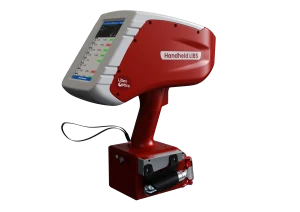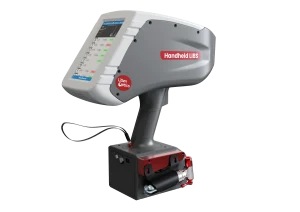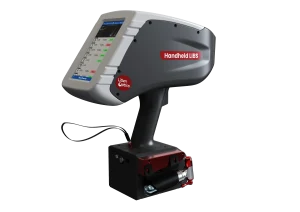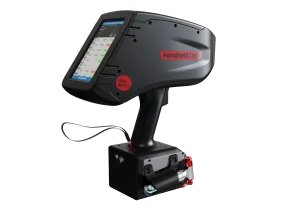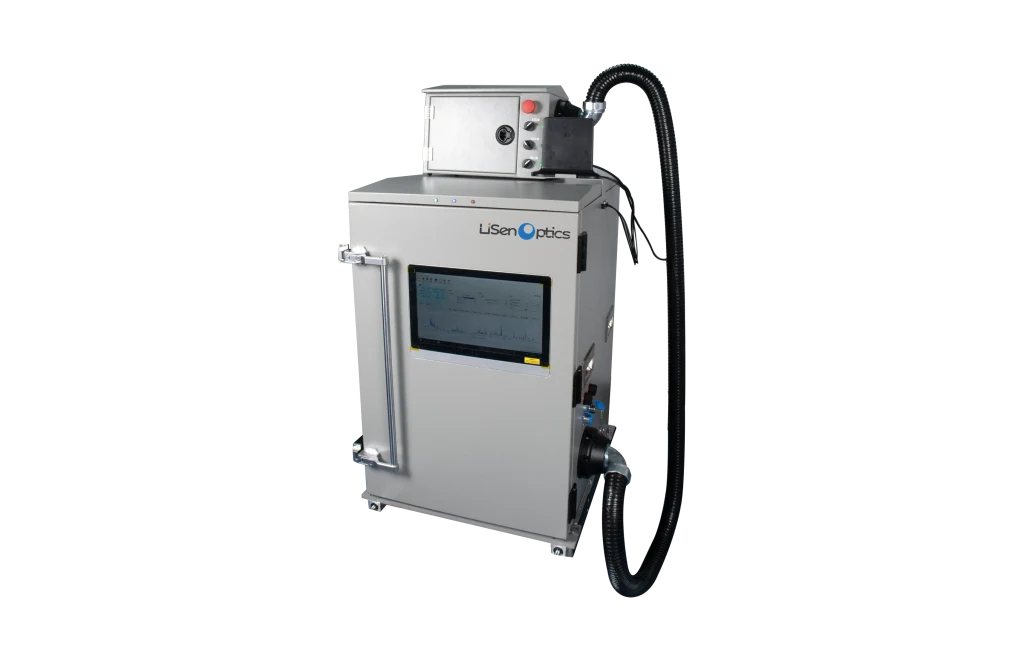
Industrial In-Line Elemental Analysis
The iSpecLIBS-IND Industrial In-Line LIBS Elemental Analyzer measures elemental composition in real time for production monitoring and process control. The system can be configured for specific process and installation requirements, with synchronized high-resolution spectrometer channels, cross-belt mounting, system monitoring, thermal management, and a rugged enclosure for dusty, high-vibration, and corrosive environments.
Intelligent distance tracking and autofocus keep the LIBS probe focused on the material surface. Precision timing electronics synchronize laser firing, spectrometer triggering, and spectral acquisition. Integrated data processing converts the spectra into quantitative elemental results.
The specifications below describe the iSpecLIBS-IND configuration in the product documentation. Elemental coverage, detection limits, and analytical performance depend on the sample, optical configuration, measurement conditions, and calibration model.
Technical Specifications
| Parameter | iSpecLIBS-IND |
|---|---|
| Product Image |
 |
| Core Technology | AI-enabled LIBS elemental analysis |
| Elemental Coverage | Si, Ca, Fe, C, H, O, and light elements such as N, Li, Be, and B, as well as most metallic and nonmetallic elements. Elemental coverage depends on the selected spectrometer configuration. Measurements requiring vacuum-ultraviolet spectral coverage, including certain analytical lines of C, S, and P, are not supported by the standard configuration. |
| Concentration Range | Percentage-level concentrations, depending on the element and instrument configuration |
| Analysis Time | <1 s |
| Analysis Modes | Qualitative, semi-quantitative, and quantitative analysis |
| Spectrometer | Four-channel spectrometer; nominal wavelength specification λ = 180-430 nm; resolution: 0.2-0.3 nm; Channel 1: 180-370 nm; resolution: 0.30 nm; Channel 2: 365-545 nm; resolution: 0.27 nm; Channel 3: 535-680 nm; resolution: 0.27 nm; Channel 4: 650-820 nm; resolution: 0.30 nm |
| Laser | Output wavelength: 1064 ± 1 nm; maximum pulse energy: ≤100 mJ; pulse width: <10 ns; repetition rate: 10 Hz; energy stability: <1%; beam divergence: ≤3 mrad; expected service life: 1.5 billion shots |
| Excitation and Collection Optics | Proprietary multichannel, high-throughput optical system integrating laser excitation and plasma-emission collection |
| Edge Computing Server | High-performance AI edge computing, high-capacity data storage, and multiple interfaces, including wired and wireless networking, USB, alarm outputs, and display connectivity |
| Sample Positioning | Automatic distance measurement and autofocus; accommodates ±75 mm variation in material height |
| Sample Imaging | Not included |
| Sample Types | Iron ores, steel, alloys, and related materials for metallurgical applications; coal particles, fuel particles, and related materials for energy-industry applications |
| Laser Spot Size | Focused spot diameter: <1 mm |
| Standard Working Distance | 400 mm, measured from the bottom of the instrument |
| AI Quantitative Analysis Module | Receives spectral data and delivers real-time quantitative results for Fe, CaO, SiO₂, and other mineral constituents. A RESTful API returns analytical results within 1 second. The optional model-development module allows users to train application-specific AI calibration models using their own samples. |
| Network Connectivity | Ethernet (RJ45) |
| Remote Operation | Supports remote display mirroring to a PC and remote measurement triggering |
| Laser Energy Monitoring | Reference optical path for real-time monitoring of laser-energy stability |
| Wavelength Calibration | Dedicated calibration optical path for real-time monitoring of wavelength-accuracy drift |
| System Self-Test | Scheduled reference-standard measurements for verification of hardware performance |
| Autofocus Range | ±100 mm |
| Thermal Management | Air conditioner with water cooling (water-supply velocity: 0.8-1.5 m/s) or compressor-based air conditioning, selected according to site conditions |
| Stability | <3%, depending on sample form |
| Analytical Accuracy | 2%-6%, depending on the analytical model |
| Detection Limit | Varies by element and sample matrix |
| Ingress Protection | IP54 |
| Automatic Purge | Automatic compressed-air purge for the protective window and sample excitation point; supply pressure: 0.7-1 MPa |
| Laser Output Direction | Vertically downward |
| Measurement Mode | Focal-point measurement |
| Safety | No radioactive source is used, and the system presents no ionizing-radiation hazard. The LIBS analyzer is safety-interlocked with the production-line start/stop controls. |
| Operating Temperature | -10 to 50 °C |
Spectral configuration note: The source specification lists a nominal wavelength range of 180–430 nm alongside four individual channel ranges extending from 180 to 820 nm. Both are retained in the table. Confirm the required spectral configuration when specifying the system.
Application in Sinter Production
In a project for a leading metallurgical engineering company in China, the system monitors sinter composition upstream of blast-furnace ironmaking. Measurements of iron grade and basicity support real-time blend adjustments and more stable production.
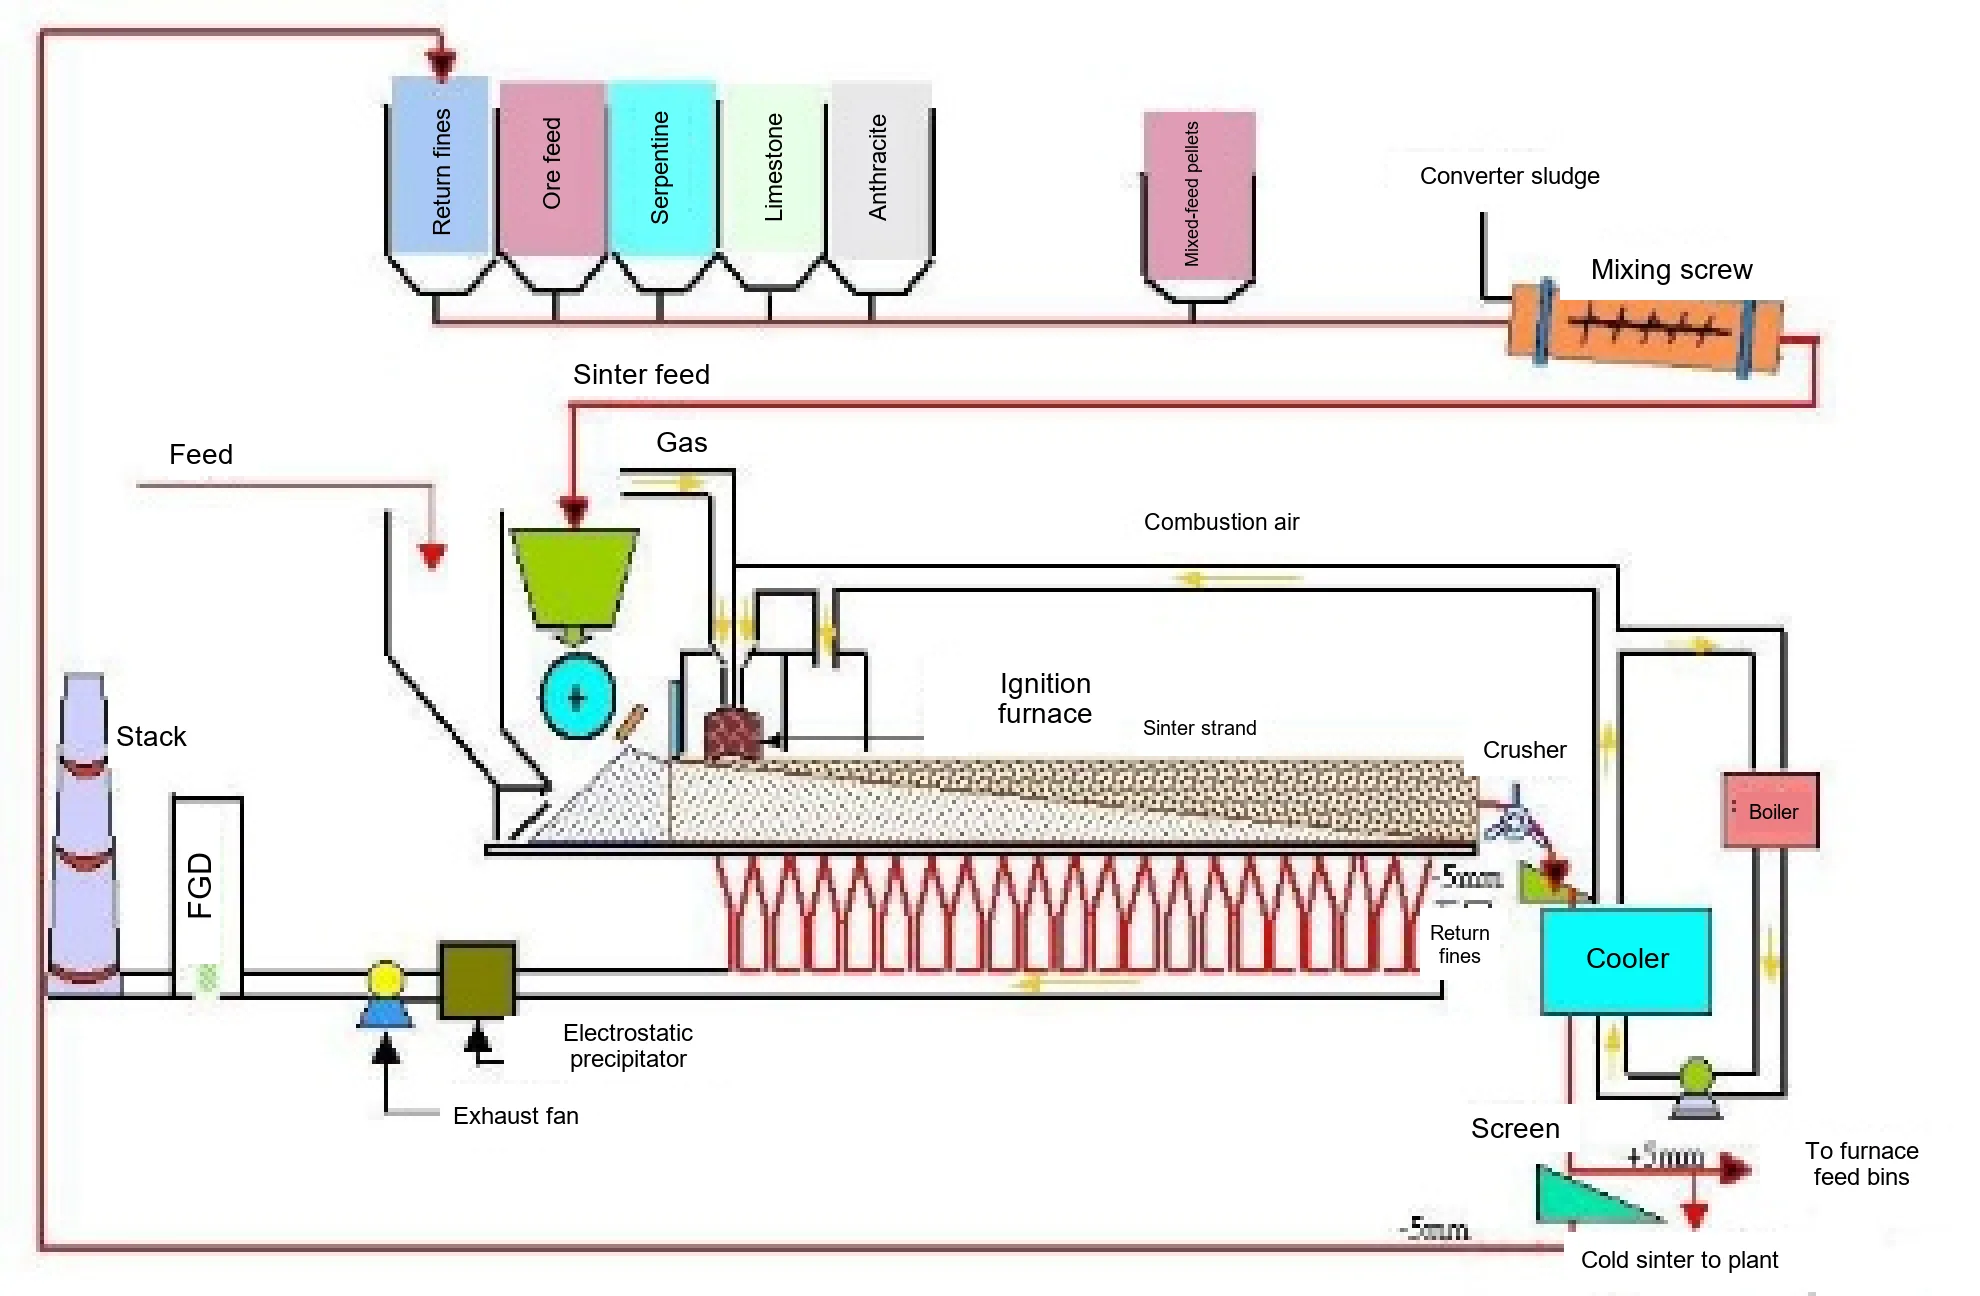
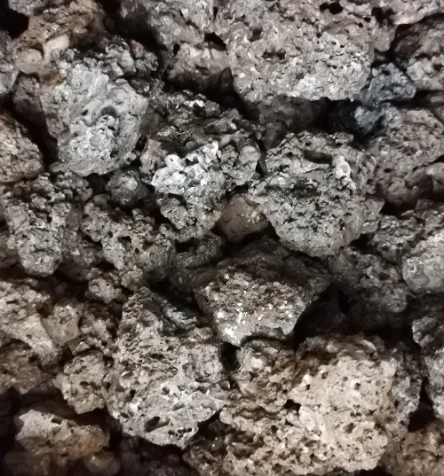
Fine iron-ore feed has poor permeability and may destabilize the blast-furnace burden. It is commonly agglomerated into sinter before charging. Sinter has a larger particle size, a porous structure, and greater mechanical strength, which help maintain stable furnace operation. During sintering, powdered iron-bearing raw materials are blended with fuel, flux, and water, then mixed and granulated. Physical and chemical reactions bond the fine particles into a strong, porous agglomerate.
Iron Grade and Basicity
Iron grade is determined by Fe content; basicity is expressed as the CaO/SiO₂ ratio. A 1% change in iron grade may change the blast-furnace fuel rate by 1%–1.5% and productivity by 2%–2.5%. When basicity falls below 1.85, each further decrease of 0.1 may increase the fuel rate and reduce productivity by approximately 3.0%–3.5%. Excessively high basicity, above 2.3, may also reduce productivity.
Measurements of Fe, Si, and Ca are used to calculate iron grade and basicity. Mg and Al can be included as optional analytes.
Measurement Before Sintering
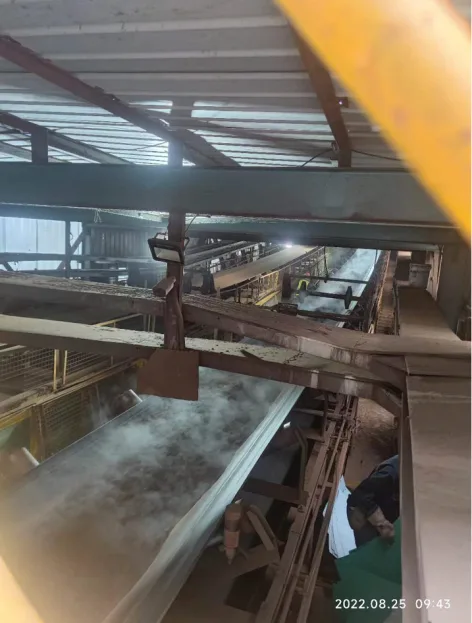
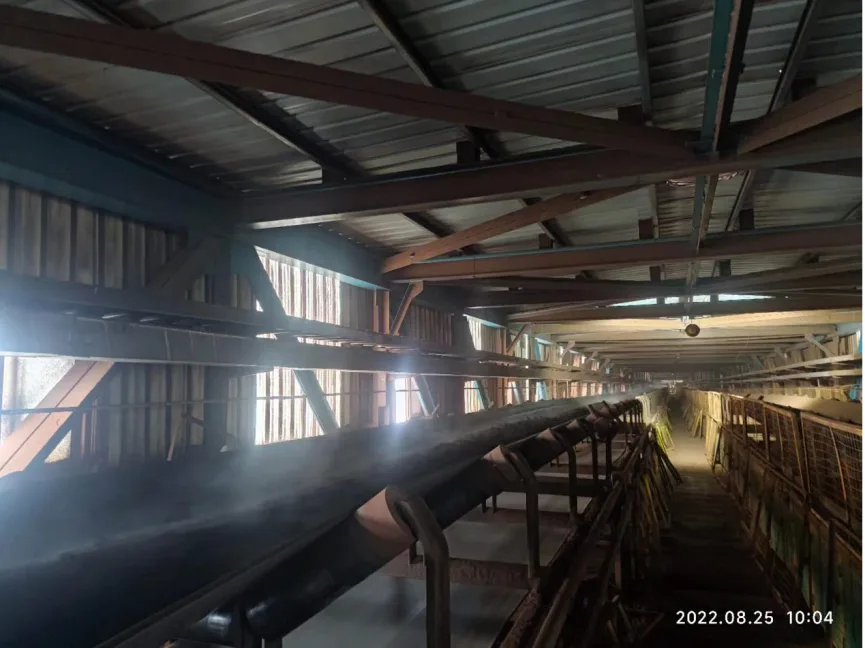
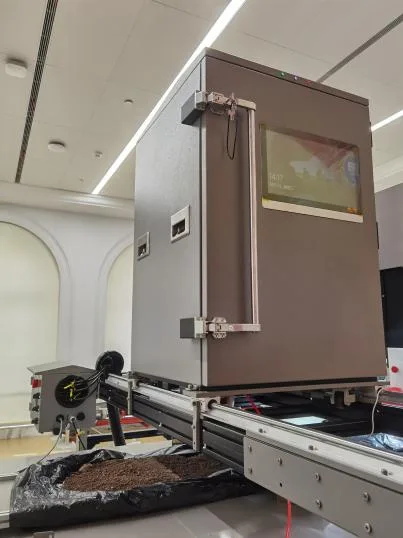
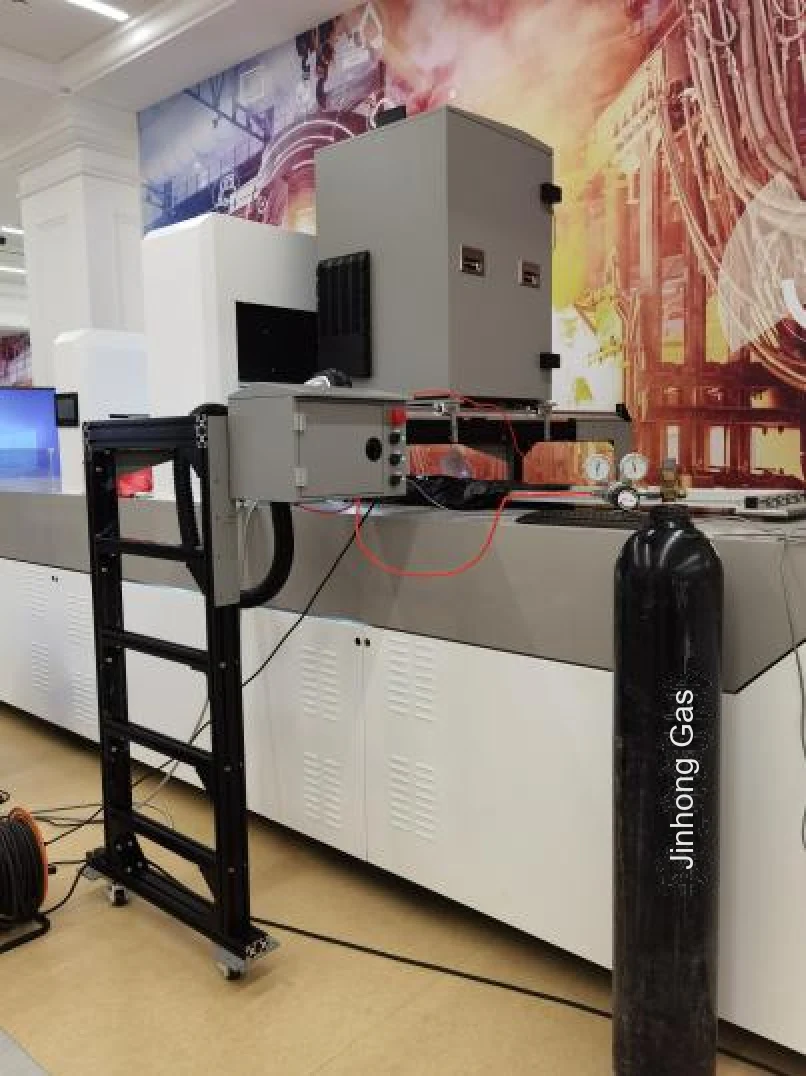
The installation shown below measures material at the secondary-mixing feed location before sintering.
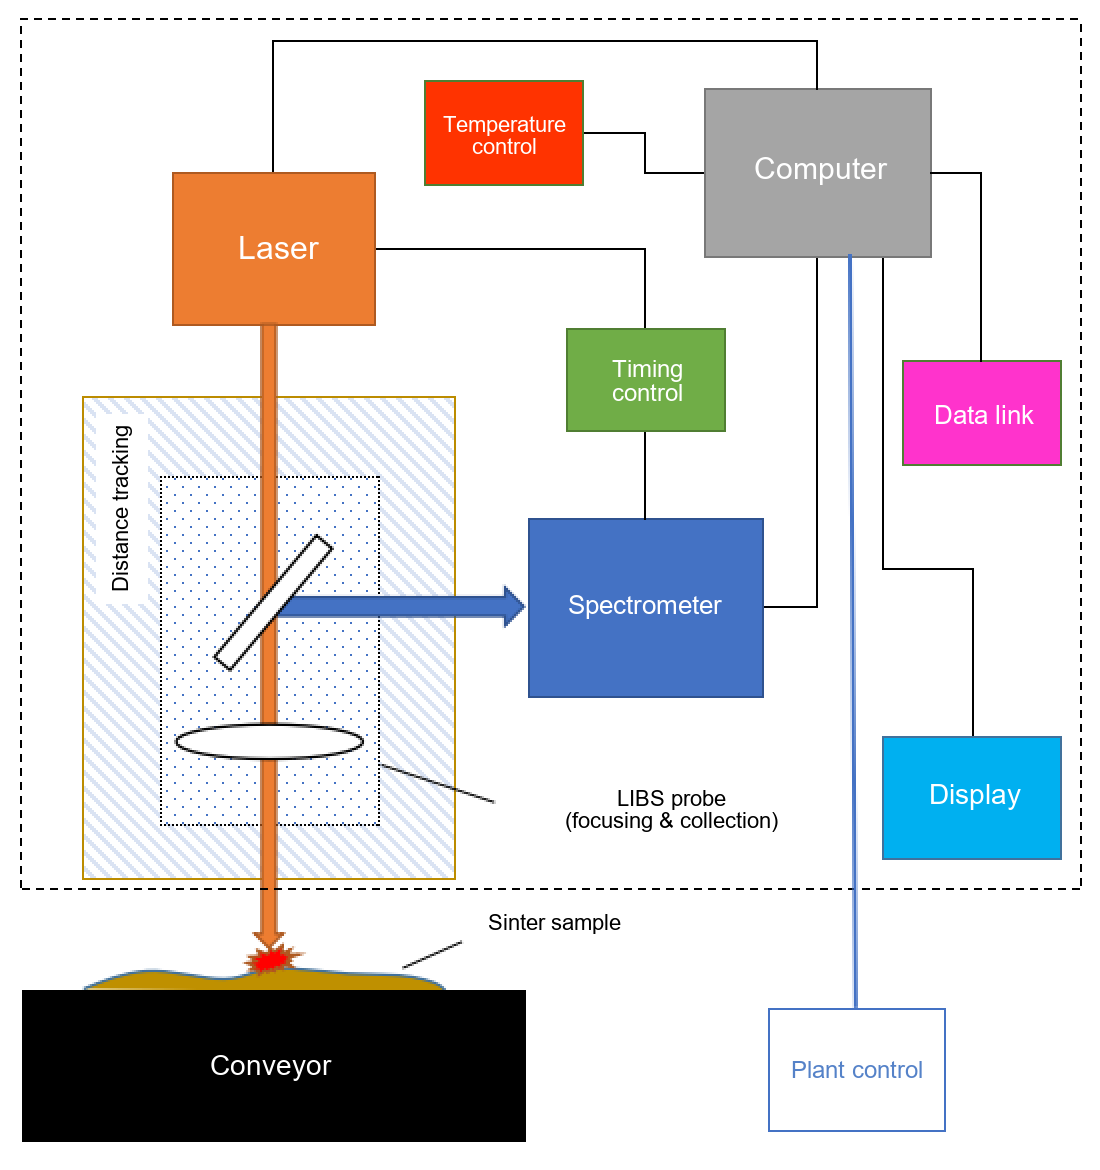
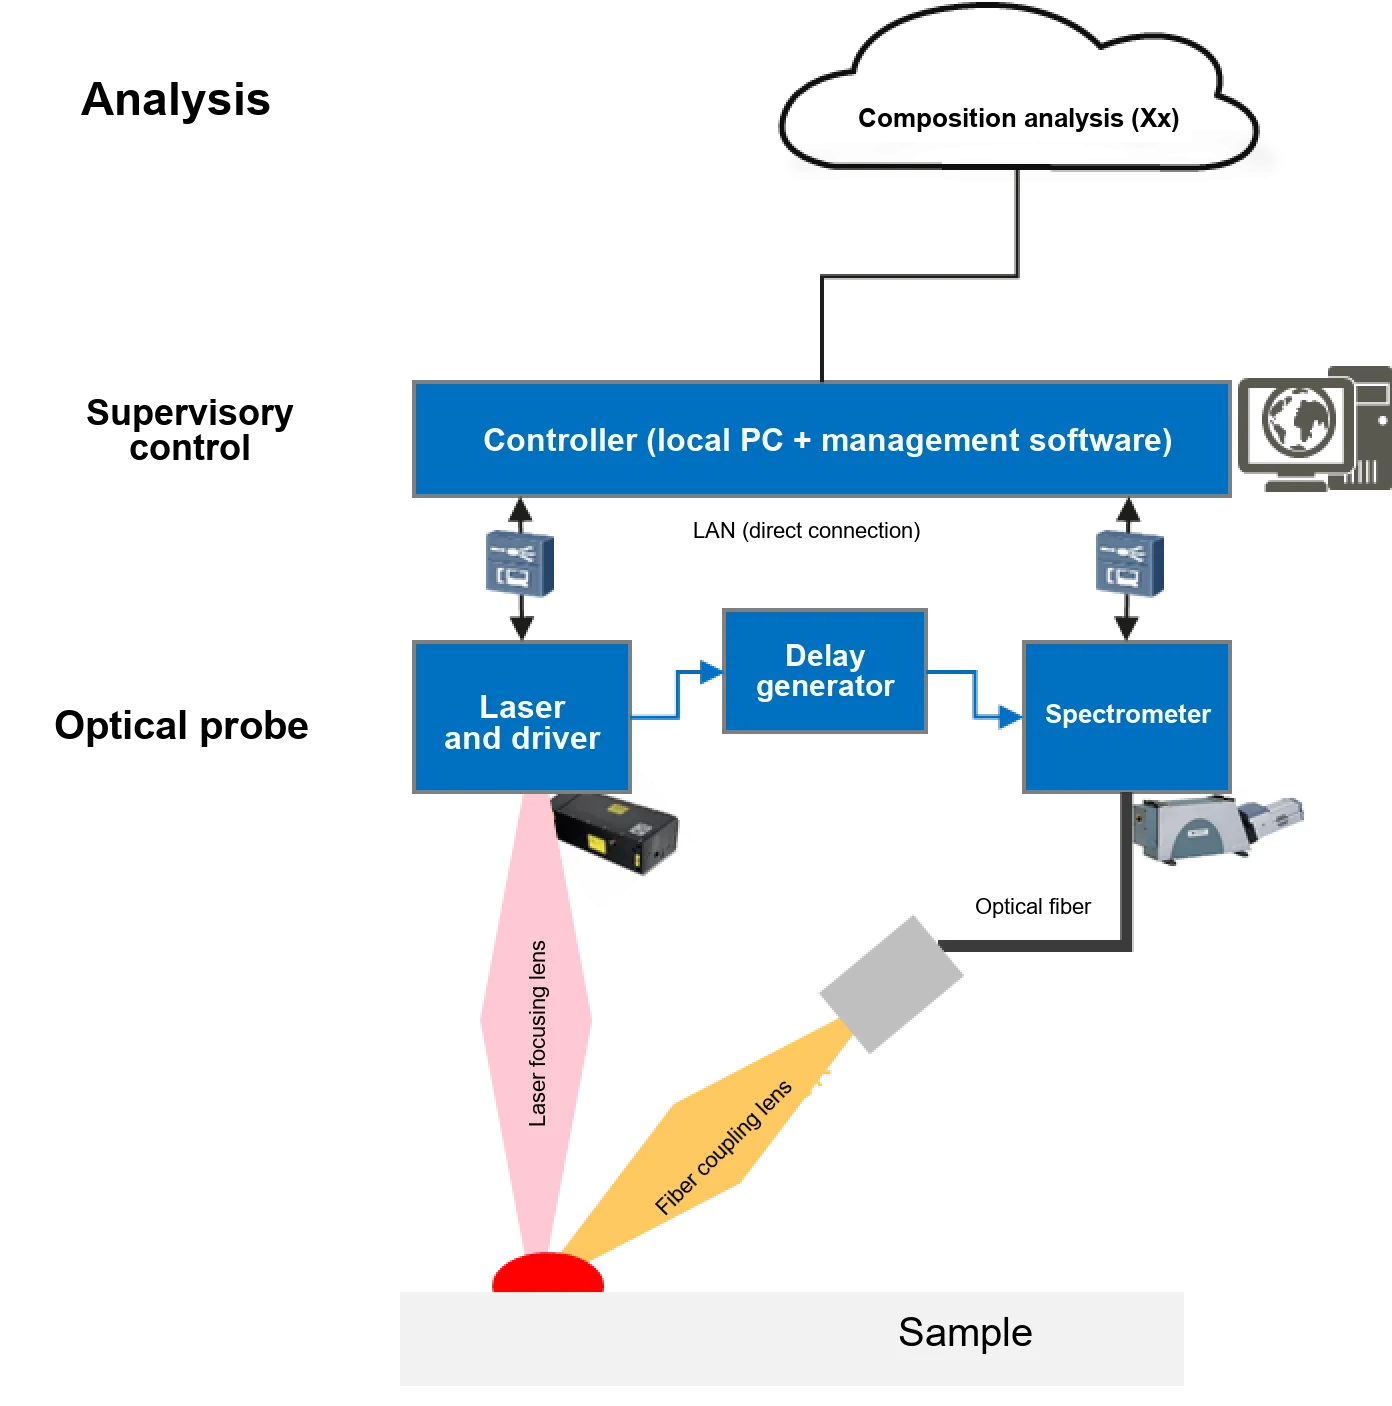
The in-line LIBS system has three main components: an optical probe for real-time spectral acquisition, a supervisory control system, and analytical algorithms. LiSen Optics provides the spectral acquisition and control subsystems.
System software controls laser firing and directs the beam through a purpose-designed LIBS probe. A distance-tracking module maintains focus on the sinter surface to produce a stable plasma signal. Precision timing electronics synchronize the spectrometers and spectral acquisition. The spectra are then preprocessed and passed to the analytical model, which returns quantitative results for Fe content and CaO and SiO₂ concentrations in real time.
Cross-Belt Installation
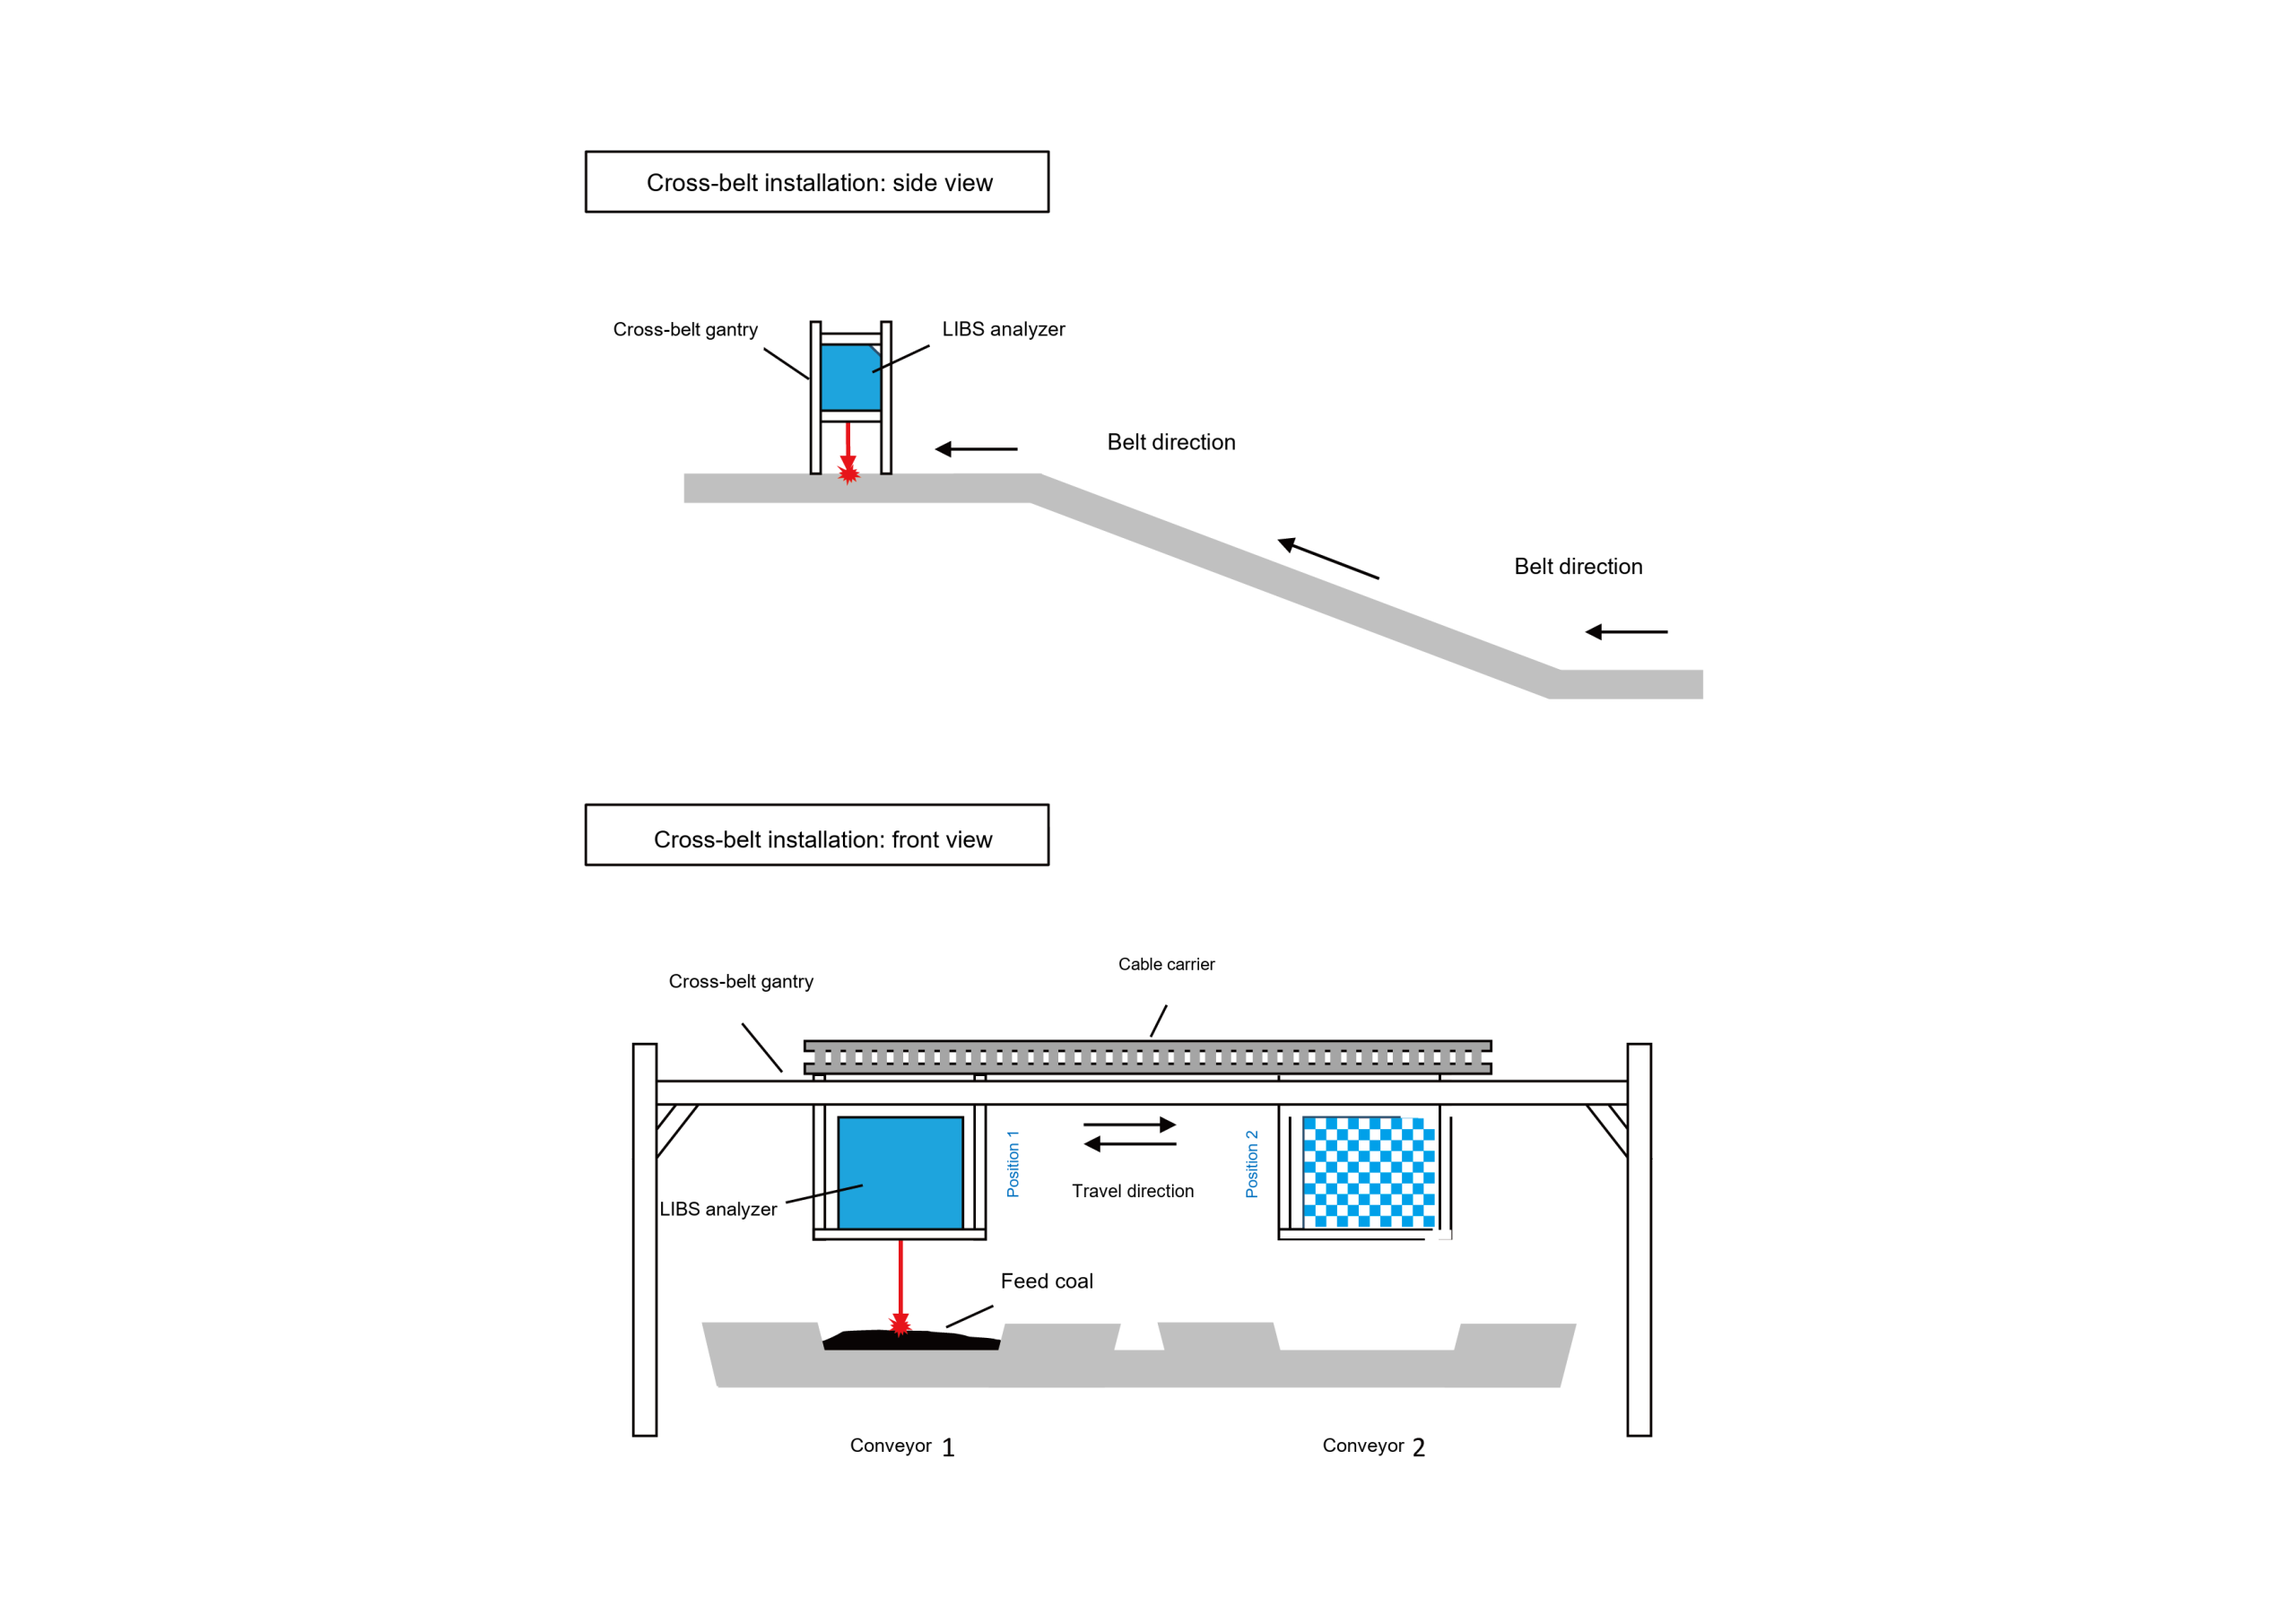
The installation drawing shows side and front views of the gantry, the LIBS instrument, and the conveyor arrangement.
Software and System Control
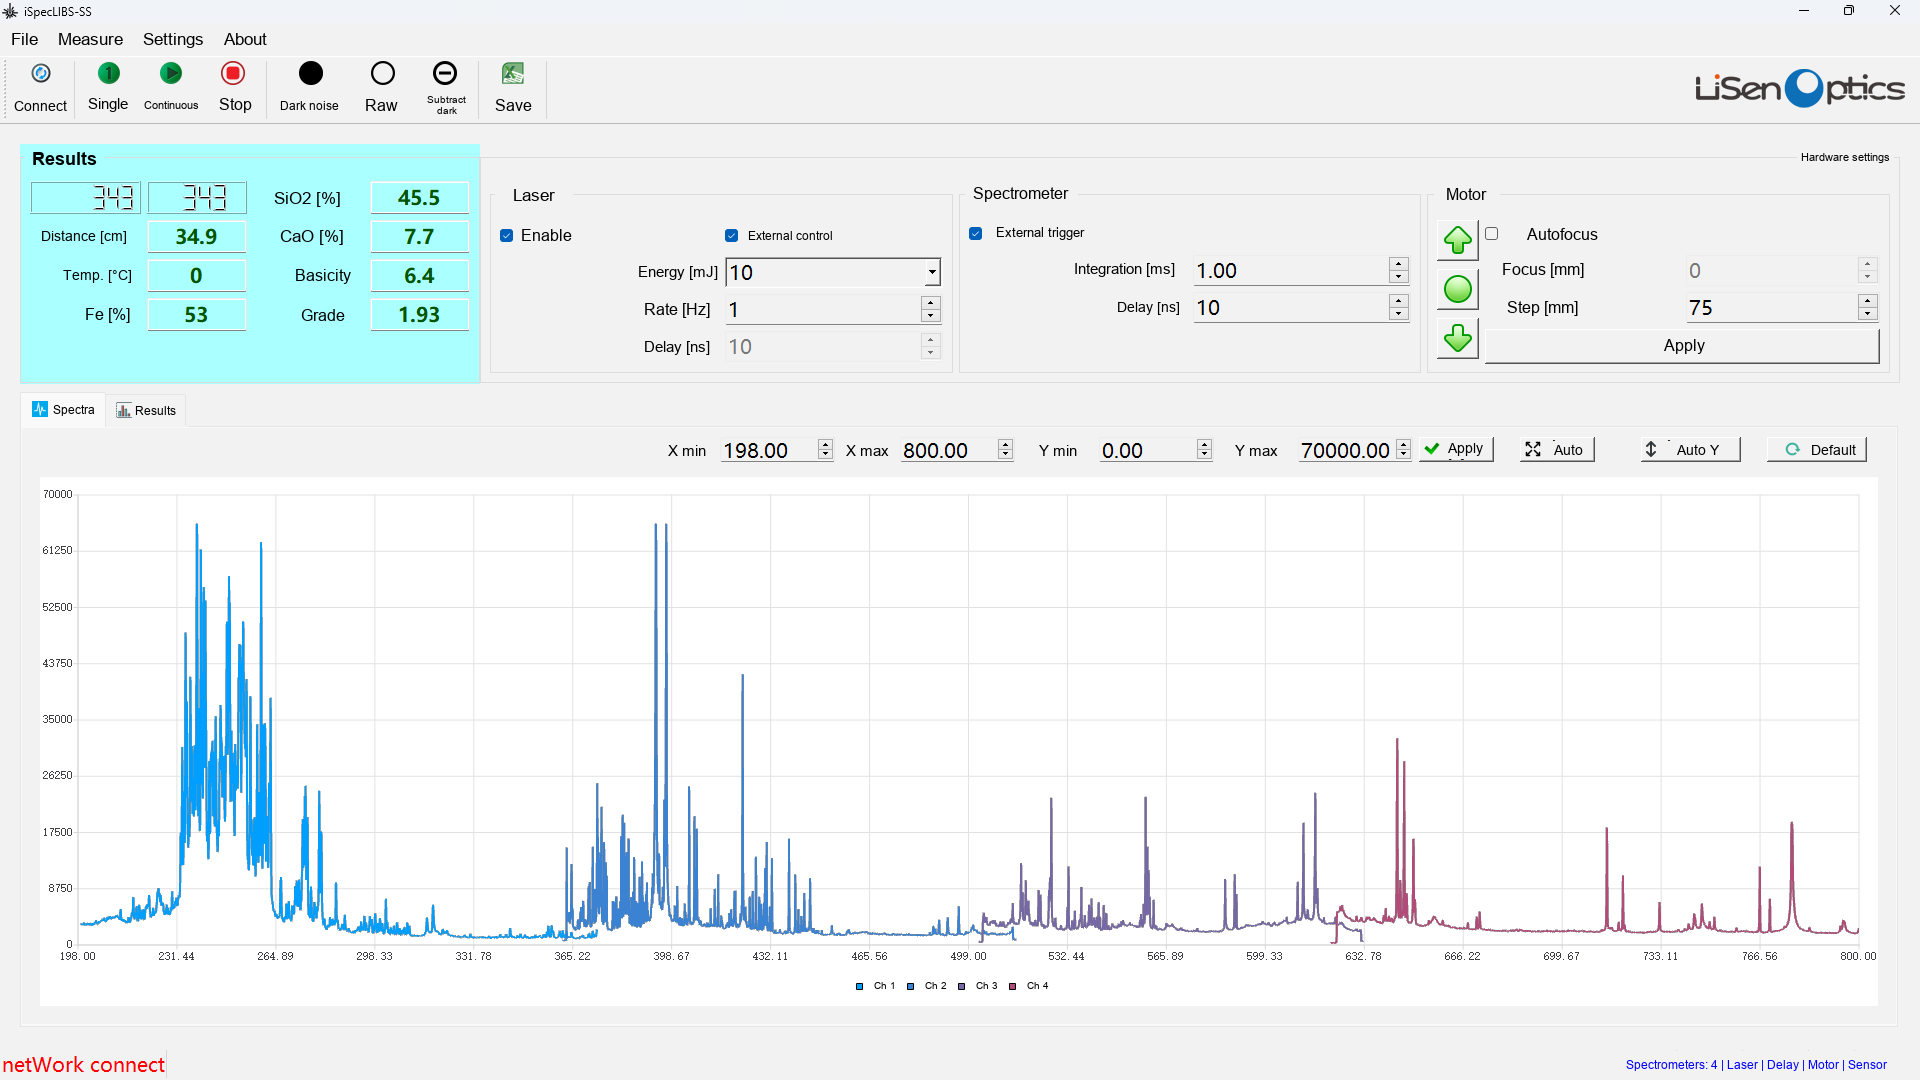
The industrial in-line LIBS spectral acquisition software coordinates the hardware, manages spectral data, and exchanges results with the analytical model and the plant control system.
- Hardware configuration: Sets spectrometer integration time, pixel smoothing, and trigger delay; laser pulse energy, repetition rate, single-shot or continuous operation, and start/stop control; delay-generator settings; and the adjustment range and frequency of distance tracking.
- Spectral acquisition: Displays LIBS spectra in real time, saves and exports spectral data, and transmits final analytical results for Fe, CaO, and SiO₂.
- Preprocessing and quality screening: Supports raw data with no preprocessing, averaging, outlier rejection, and configurable rejection criteria before validated spectra are sent to the analytical model.
- Plant integration: Receives model results, displays them locally in real time, and sends them to the central control PLC through an internal communication protocol.
Installation and Testing
How LIBS Measures Elemental Composition
Laser-induced breakdown spectroscopy uses a high-energy laser pulse to ablate a few micrograms of material from the sample surface. This creates a short-lived, luminous plasma at temperatures of approximately 10,000 °C. Within the plasma, the ablated material dissociates into excited atoms and ions. As the plasma expands and cools, these species return to lower energy states and emit light at wavelengths characteristic of individual elements. A high-sensitivity spectrometer captures the emission spectrum to determine the sample’s elemental composition.
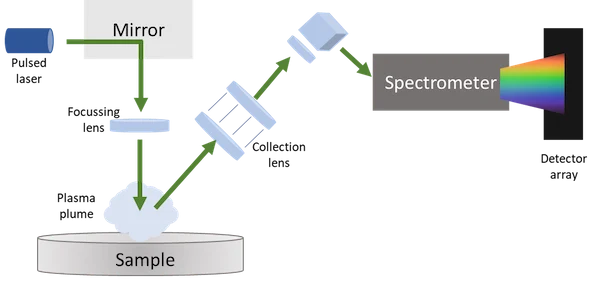
A typical LIBS analyzer includes a laser, focusing optics, plasma-emission collection optics, and a high-resolution spectrometer. A complete system also commonly includes precision timing controls, a sample interface or chamber, and data-analysis software.
Typical Elemental Detection Limits
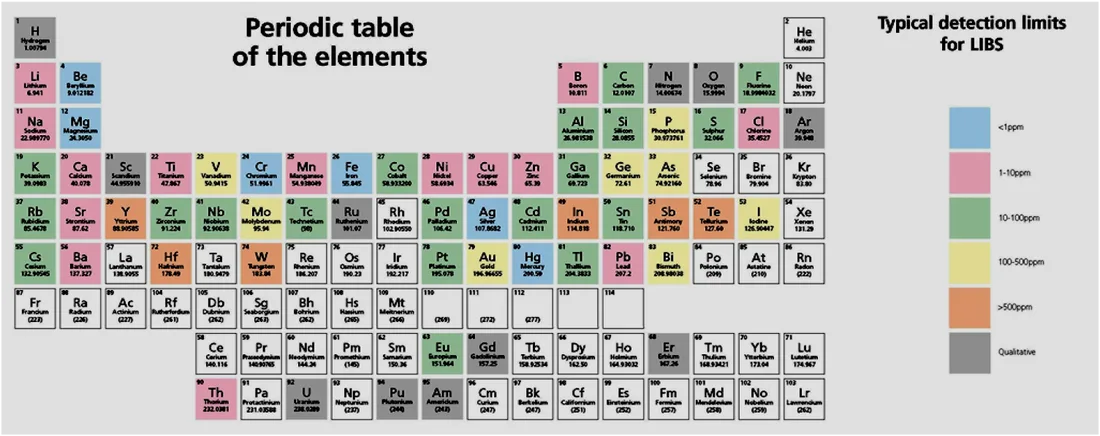
- Li, Be, B, Na, Mg, Al, K, and Ca: approximately 10 ppm (0.001%).
- Ti, V, Cr, Mn, Fe, Co, Ni, Cu, Zn, and Mo: approximately 100 ppm (0.01%).
- C, N, O, P, and Si: approximately 200 ppm (0.02%).
- F, Cl, Br, and S: approximately 0.5%.
These are typical LIBS detection limits, not guaranteed limits for every iSpecLIBS-IND configuration. Actual limits depend on the element, sample matrix, instrument configuration, measurement conditions, and calibration method.
What the Emission Spectrum Reveals
A LIBS spectrum is an optical emission spectrum produced by a laser-induced plasma. Plasma-diagnostics principles and reference atomic-emission data allow it to provide information about plasma temperature, electron number density, and elemental or species composition.
- Characteristic wavelengths: Atomic and ionic emission lines serve as spectral fingerprints. Multiple diagnostic lines are usually evaluated to improve the accuracy and reliability of element identification.
- Emission-line intensity: Under local thermodynamic equilibrium (LTE) and optically thin plasma conditions, line intensity is related to the population of the emitting species and can be correlated with elemental concentration. Quantitative analysis usually relies on calibration models that account for matrix effects and measurement conditions.
- Spectral-line broadening: Measured line profiles can include natural, Doppler, Stark, pressure, resonance, van der Waals, and instrumental broadening. Their relative contributions depend on plasma conditions, the selected emission line, and spectrometer resolution.
Timing and Spectral Acquisition
LIBS emission develops through time-dependent excitation, ionization, recombination, and interactions among electrons, ions, atoms, molecules, and clusters in the plasma.
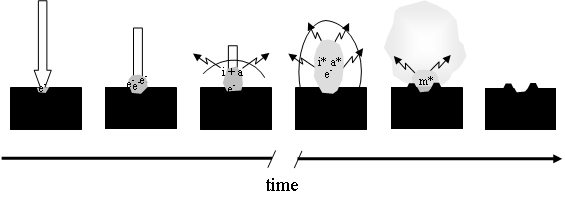
Time-resolved measurements show that LIBS spectra change substantially with gate delay. Early emission is dominated by a strong bremsstrahlung continuum, generated primarily by Coulomb interactions between electrons and ions. The discrete electronic transitions responsible for characteristic emission lines become easier to observe as the continuum decays.
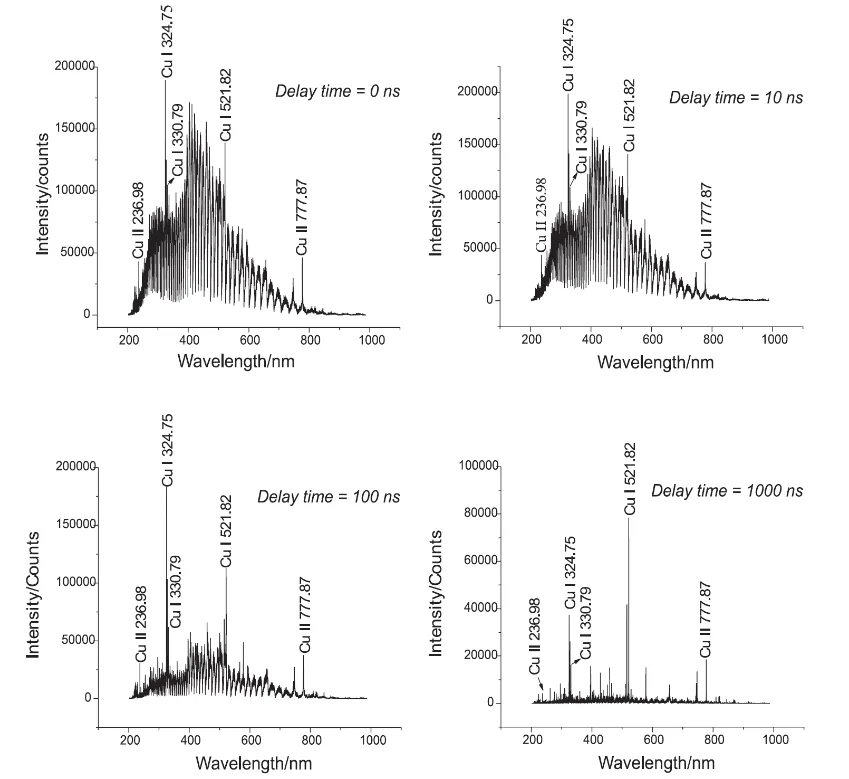
To obtain the best signal-to-noise ratio, the spectrometer must acquire data at a precisely controlled gate delay. Trigger timing accuracy should typically be within 10 µs; approximately 1 µs is preferred for demanding applications.
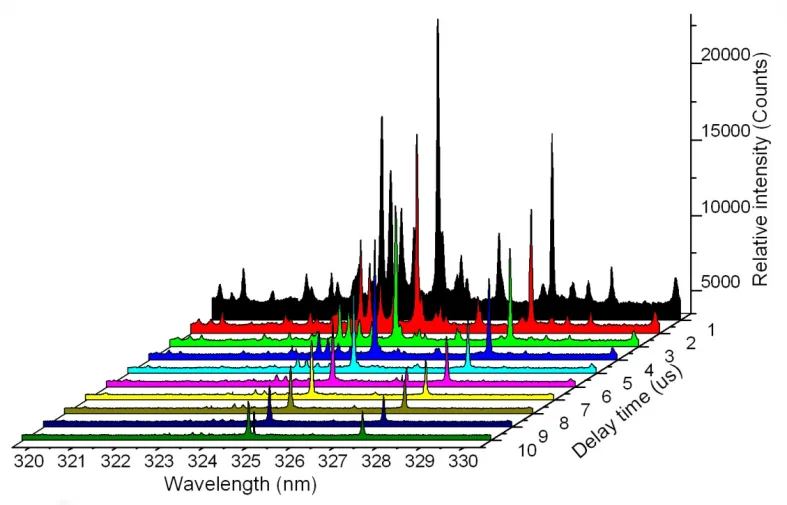
Exposure time is also critical. Shorter integration times help prevent detector saturation when LIBS signals are strong, while longer integration times improve the signal-to-noise ratio when emission is weak.
Stable LIBS measurements require consistent laser energy, efficient and precise focusing and collection optics, and accurate timing control. Reliable qualitative and quantitative analysis also depends on spectrometer timing accuracy, signal-to-noise performance, and appropriate data-processing algorithms.