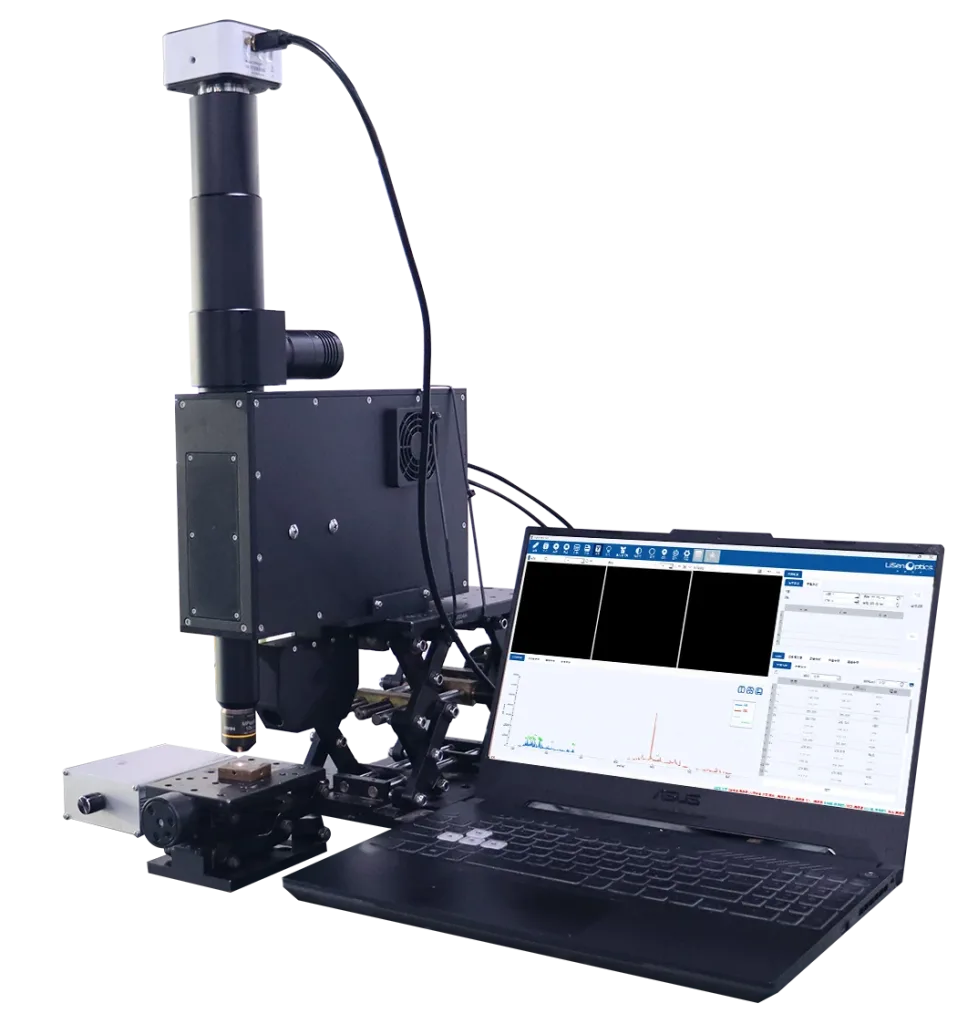
Microscopic Elemental Analysis
The LiSen Optics iSpecLIBS-OEM-A combines high-resolution microscopy with laser-induced breakdown spectroscopy (LIBS) for rapid elemental analysis of precisely selected areas. A tightly focused pulsed laser creates a microplasma on the sample. The system analyzes the emitted spectrum to identify and quantify the elements at the point shown in the microscope image.
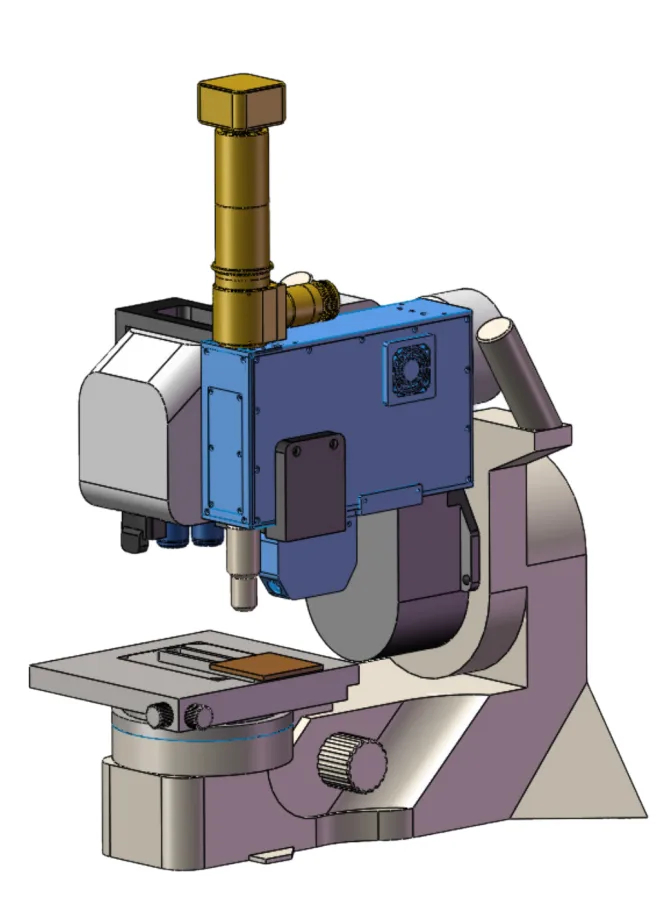
This dedicated microscopic LIBS module integrates a pulsed laser, a high-resolution spectrometer, excitation and collection optics, microscopic imaging, trigger-delay control, and analysis software. It is compatible with Olympus DSX1000 and DSX2000 microscopes and other digital microscopes with extended depth of field.
The system supports material identification, classification, and composition analysis in metals, battery materials, food, pharmaceuticals, automotive components, and other advanced materials.
Technical Specifications
| Parameter | iSpecLIBS-OEM-A |
|---|---|
| Product Image |
 |
| Elemental Range | Broad coverage of alloy-related elements, including Fe, Al, Cu, Mg, Ni, Pb, Cd, and selected nonmetals such as C |
| Concentration Range | ≥0.1% (dependent on element, matrix, and measurement conditions) |
| Analysis Time | <1 s |
| Analysis Modes | Semi-quantitative and quantitative analysis |
| Dual-Channel Spectrometer | CH1: 180–430 nm, resolution ≤0.3 nm; CH2: 365–545 nm, resolution ≤0.25 nm (custom wavelength ranges available) |
| Laser | 1064 nm; >10 mJ/pulse; 10 Hz; <3 ns pulse width; pulse-energy stability <3% |
| Sample Types | Metal grades and alloys; also suitable for minerals, rocks, ceramics, semiconductor materials, fossil fuels, soils, and solid composites |
| Analysis Spot Size | 1064 nm: <80 µm; 532 nm: <50 µm; 355 nm: <25 µm |
| Working Distance | 50 mm |
| Beam Orientation | Vertical |
| Measurement Geometry | At the focal plane |
| Laser Safety | No ionizing radiation; no radioactive-source licensing required |
| Operating Temperature | 15–35 °C |
| Supported Use Cases | Metal grade identification, laboratory research, LIBS demonstrations, and microscope integration; built-in forced-air cooling |
| Communications | USB/TCP |
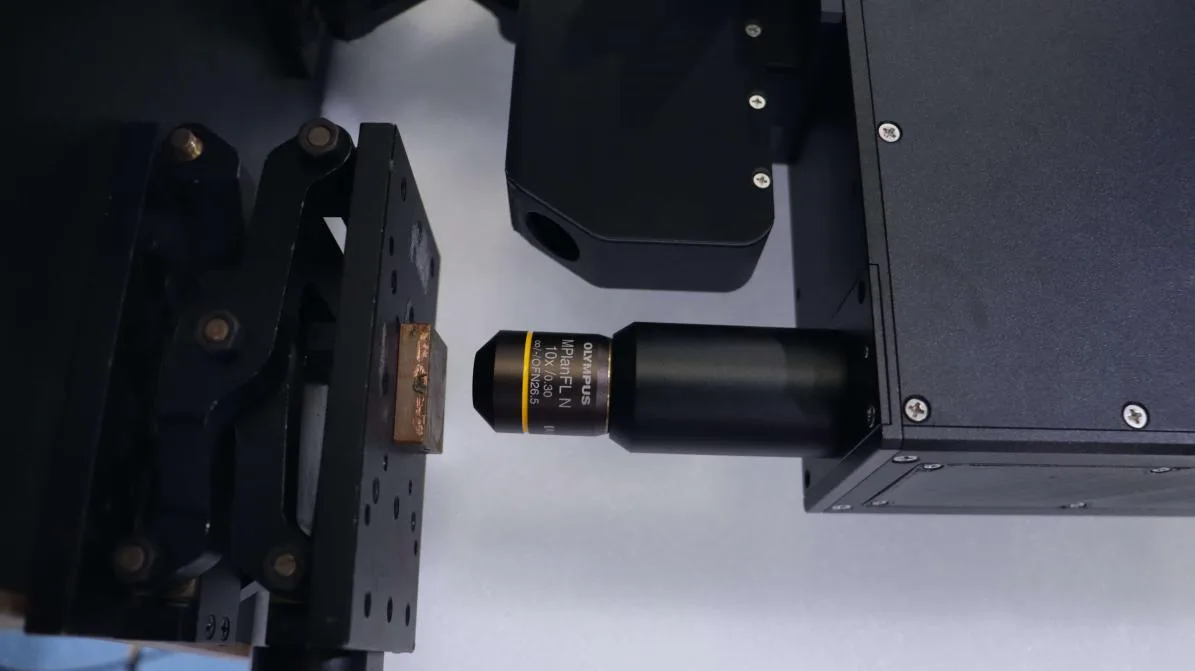
Microscope Integration
LIBS Operating Principle
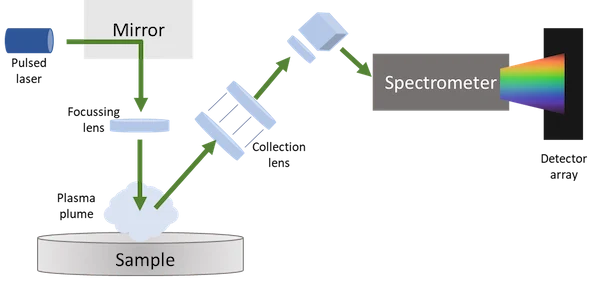
A focused laser pulse removes a small amount of material and generates a plasma. Collection optics guide the emitted light to the spectrometer, where characteristic spectral lines identify the elements present. Microscopic imaging allows the operator to select a small region of interest before analysis.
Typical LIBS Detection Limits
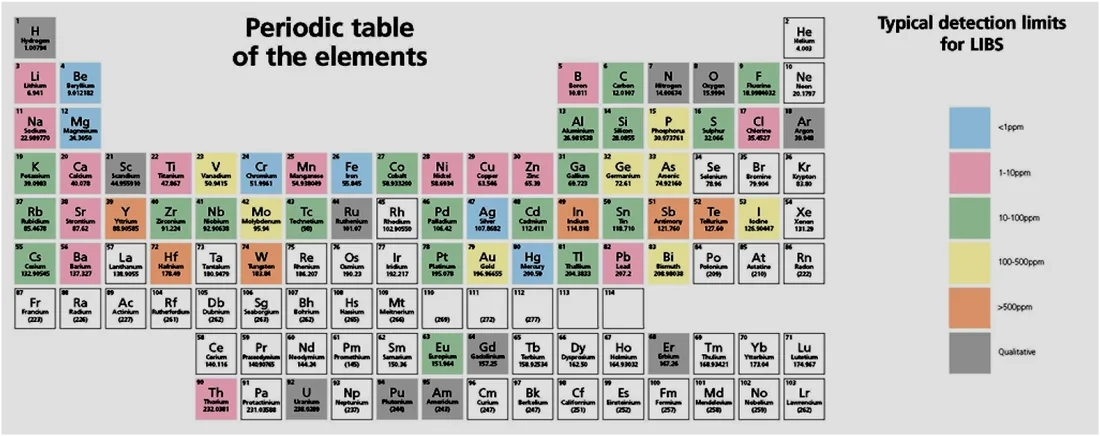
LIBS can detect nearly all elements, including light elements such as C, H, O, N, Li, Be, and B. Typical detection limits for many elements are in the 10–100 ppm range. The following values describe representative LIBS detection limits:
- Li, Be, B, Na, Mg, Al, K, and Ca: approximately 10 ppm (0.001%).
- Ti, V, Cr, Mn, Fe, Co, Ni, Cu, Zn, and Mo: approximately 100 ppm (0.01%).
- C, N, O, P, and Si: approximately 200 ppm (0.02%).
- F, Cl, Br, and S: approximately 0.5%.
Actual detection limits vary with the element, sample matrix, and measurement conditions. The model-specific concentration range is listed in the technical specifications above.
LIBS Spectral Acquisition and Analysis Software
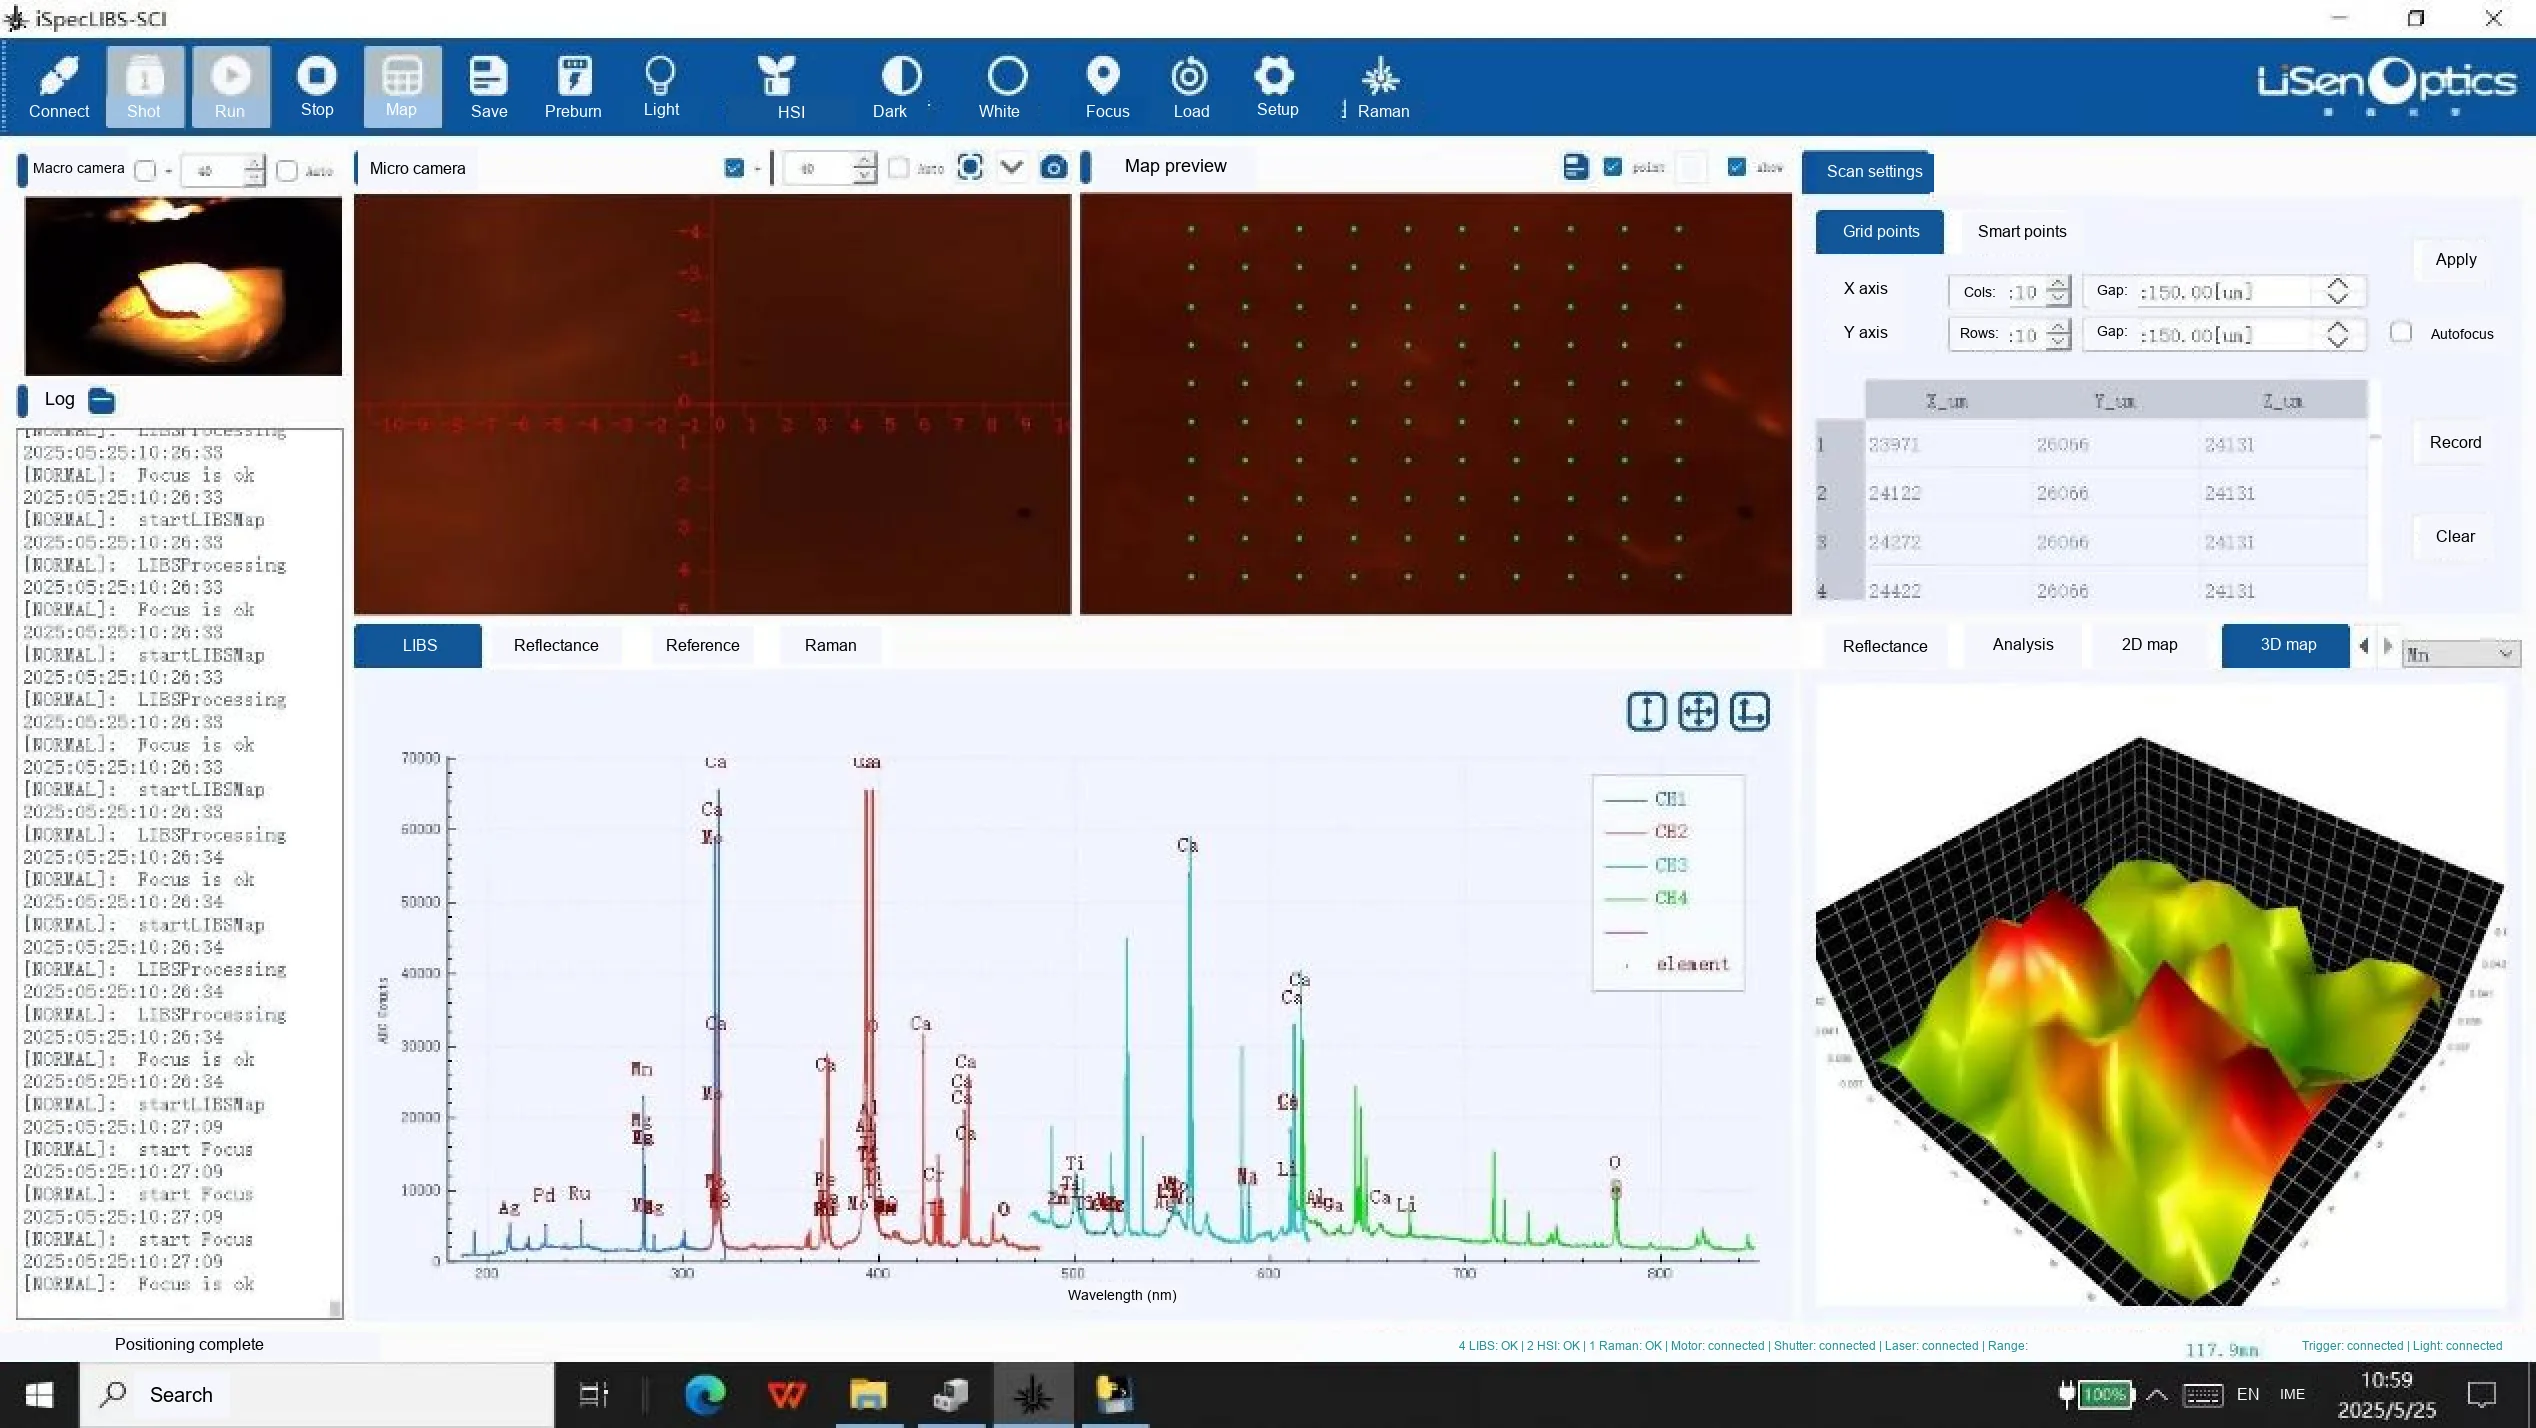
The software provides automatic peak detection, spectral matching, real-time concentration prediction, and quantitative calibration using peak height, peak area, and spectral intensity ratios. Available functions vary between the iSpecLIBS-STD Basic and iSpecLIBS-SCI Professional editions.
| Software Function | iSpecLIBS-STD (Basic) | iSpecLIBS-SCI (Professional) |
|---|---|---|
| LIBS spectral data acquisition | Yes | Yes |
| Pulse trigger-delay generator control | Yes | Yes |
| Dual-laser aiming, image-based focus control, and synchronized 3-axis stage control | No | Yes |
| Camera image acquisition and display | No | Yes |
| User-defined spectrometer integration time, number of averages, and trigger delay | Yes | Yes |
| User-defined laser pulse energy and repetition rate | Yes | Yes |
| Real-time autofocus and fixed-focus operation | No | Yes |
| Preview, save, and analyze spectra from multiple sample types | Yes | Yes |
| Automatic peak finding and element identification with real-time comparison to reference lines | Yes | No |
| Position-resolved mapping with stepped scanning of channel settings, integration time, trigger delay, and laser energy; supports up to 10,000 acquisition points | No | Yes |
| Spectral preprocessing, including background correction, baseline correction, and peak-intensity normalization | No | Yes |
| Environmental and matrix-effect correction to improve quantitative reliability | No | Yes |
| Simultaneous multi-element analysis with spectral deconvolution for overlapping emission lines | No | Yes |
| Custom model training and calibration with linear or polynomial fitting, peak ratios, and peak-area calculations | No | Yes |
| Results reporting and validation, including concentrations, uncertainty estimates, and statistical significance | No | Yes |
| Interfaces for machine-learning and deep-learning algorithms to improve complex-sample identification and quantitation | No | Yes |
| Image-based region segmentation, autofocus, automated point selection, qualitative and quantitative analysis, and elemental concentration mapping | No | Yes |
Mineral Identification and Elemental Mapping
The Professional software examples show reflectance hyperspectral mineral identification, AI-based mineral mapping, three-dimensional elemental concentration mapping, and two-dimensional elemental distribution visualization.
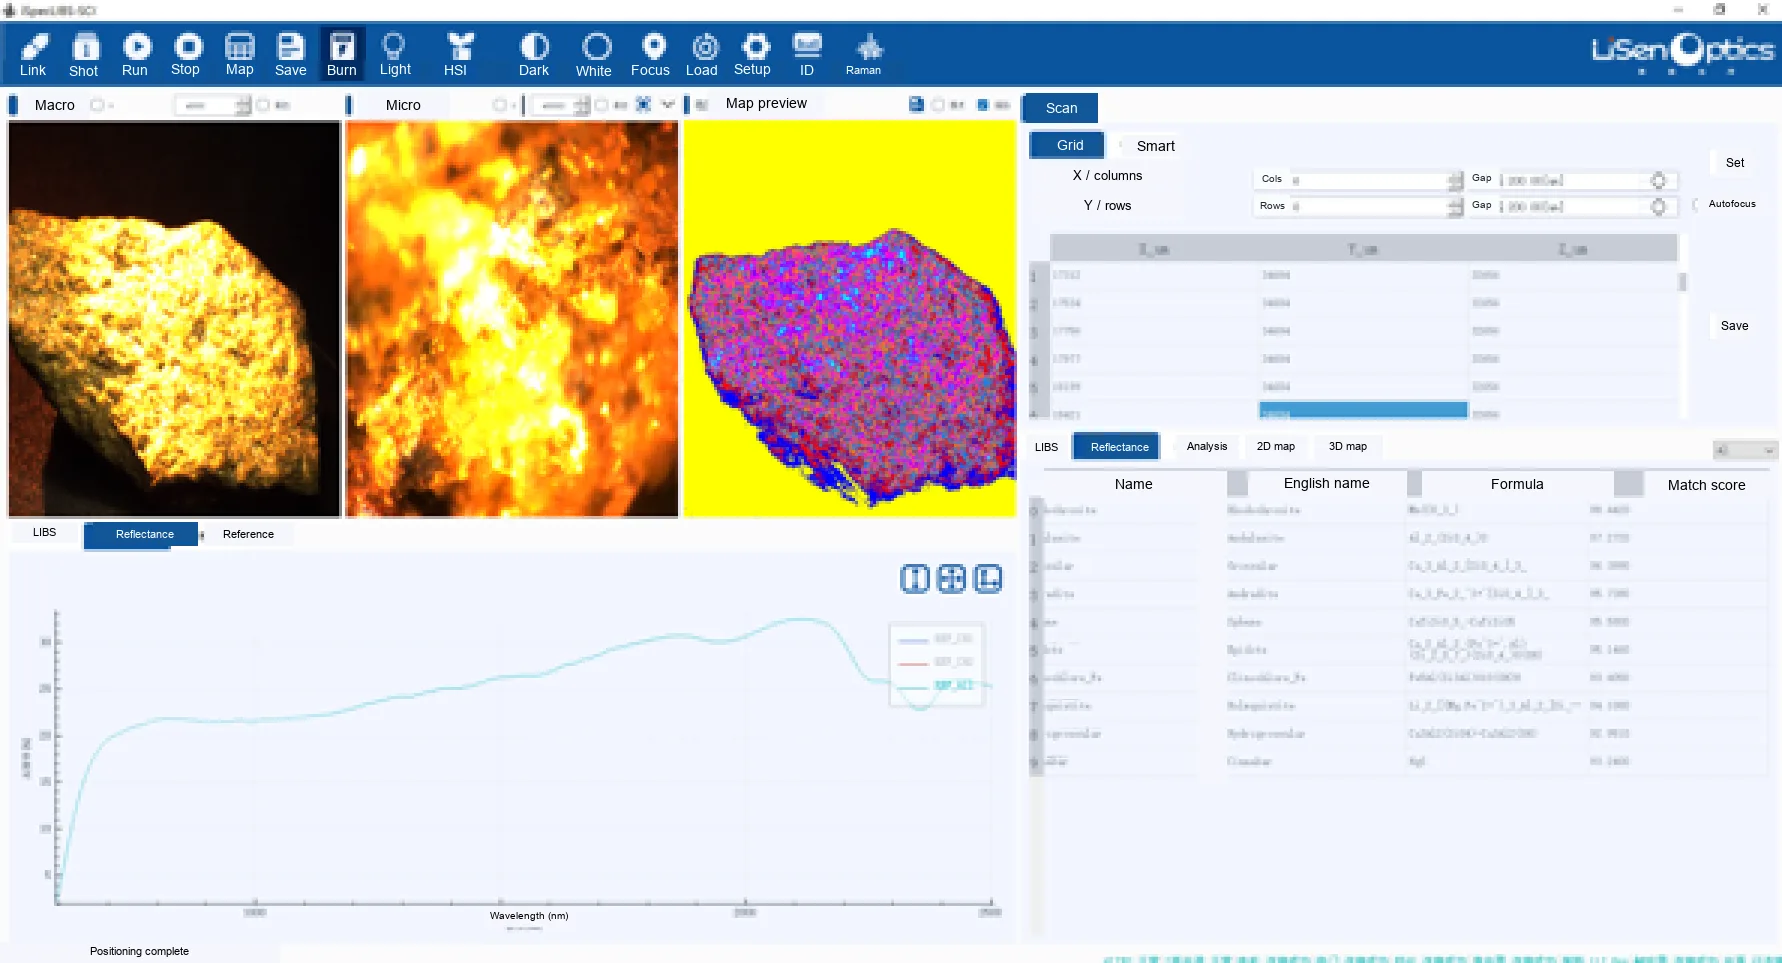
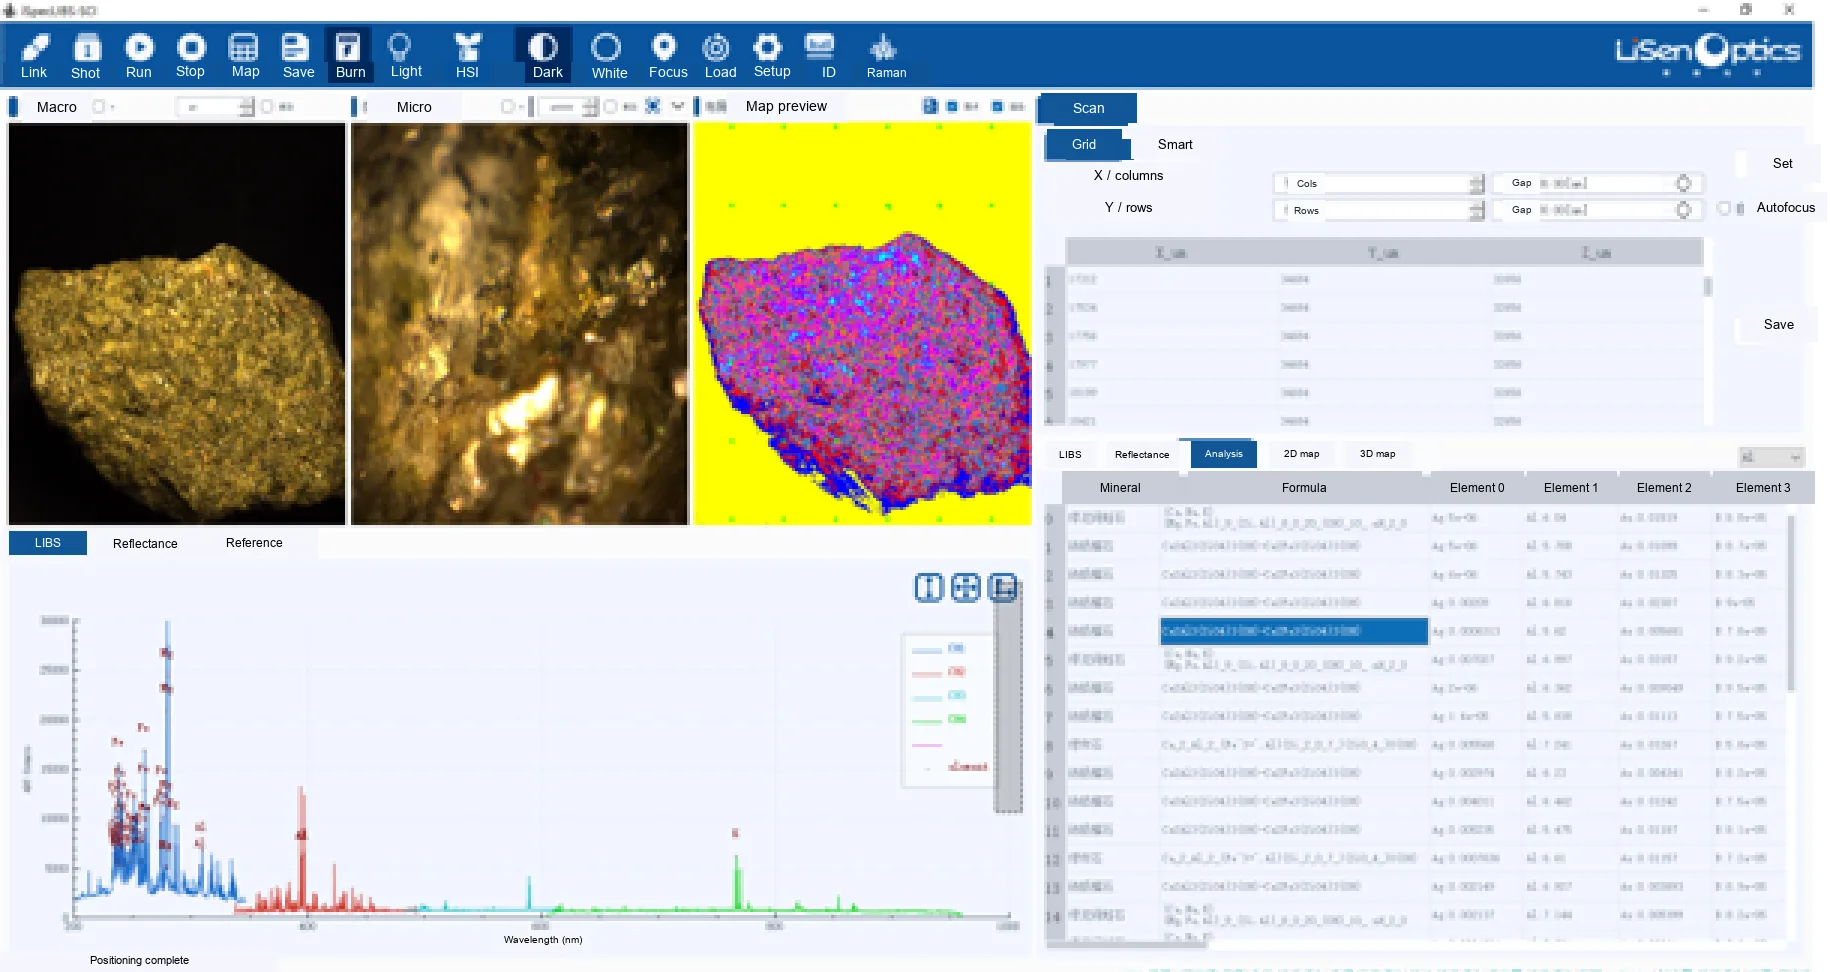
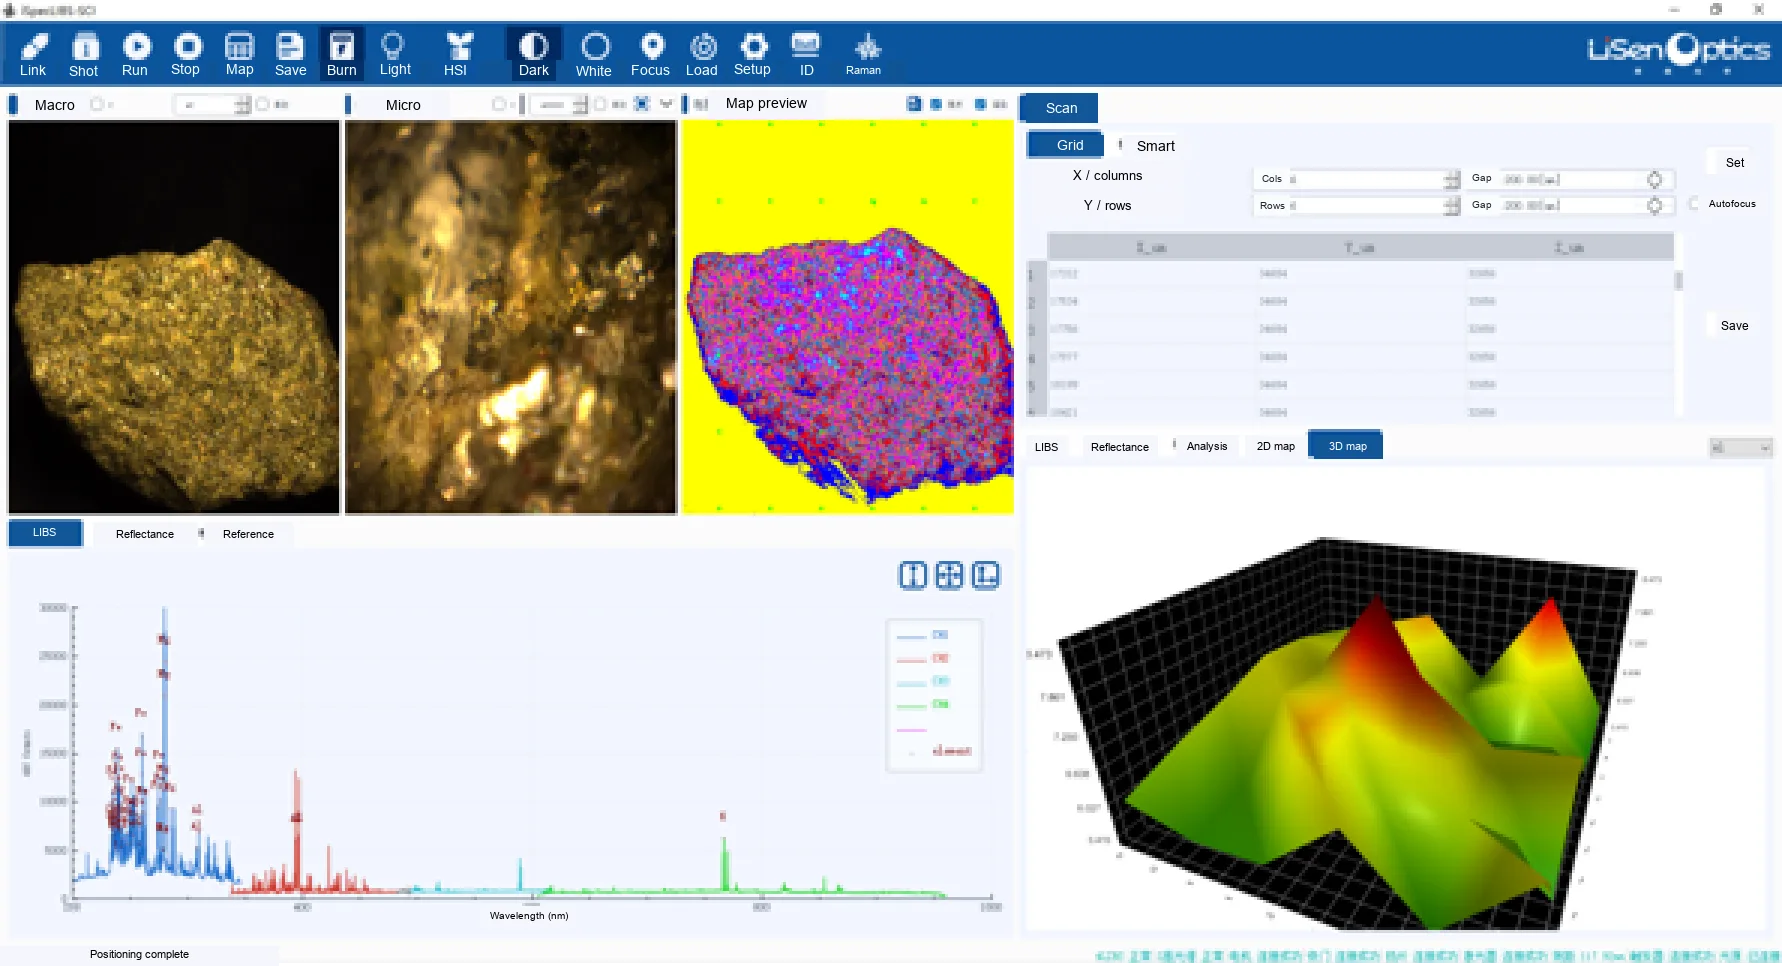
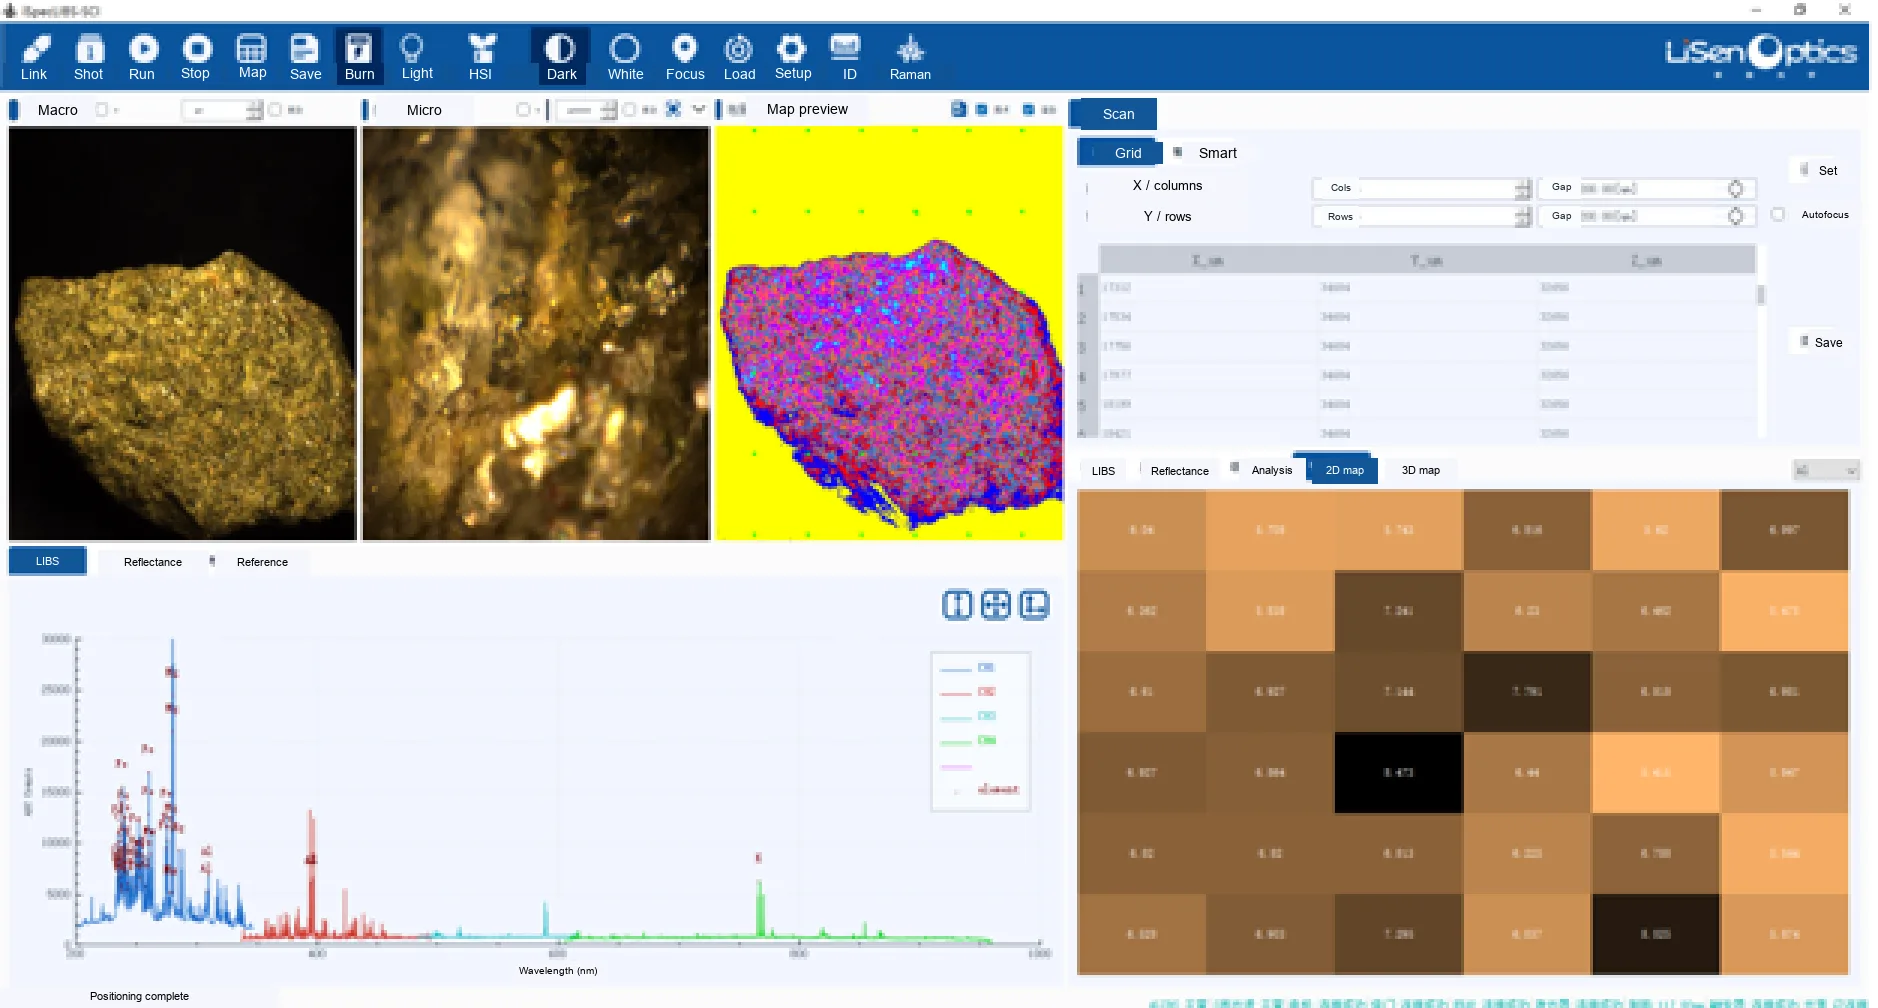
The software screenshots retain the original measurement results. Some fine result labels and status text remain in the source language because the supplied images are too small for reliable translation.
Applications
Electronic Contamination Analysis
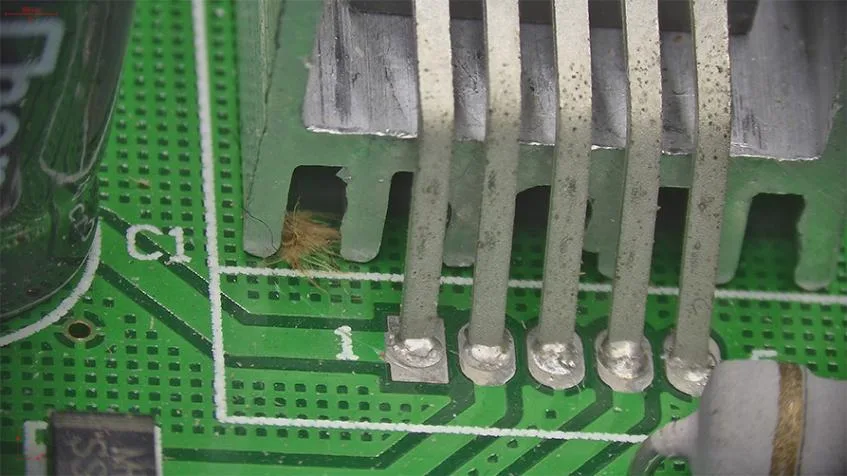
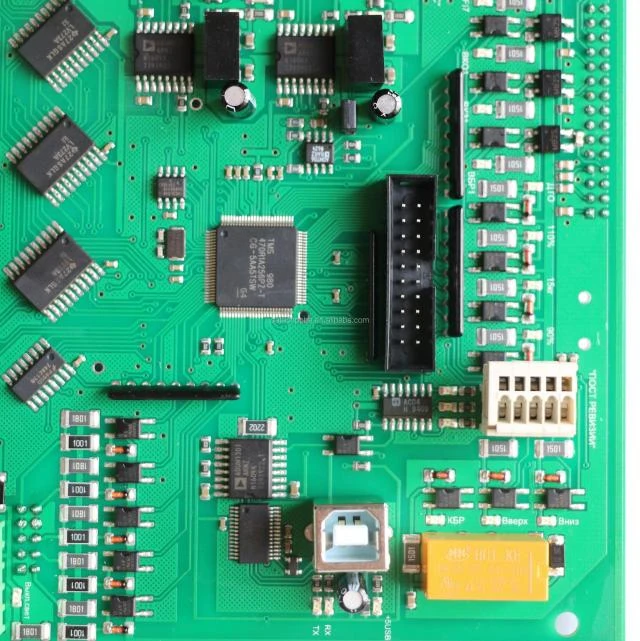
High-magnification imaging and rapid elemental analysis help investigate printed circuit boards, connectors, and other precision electronic components. The microscope reveals connector pins, solder joints, and surface contaminants, while LIBS spectra identify their elemental composition and help engineers determine possible sources of contamination.
Layer-by-Layer Elemental Analysis
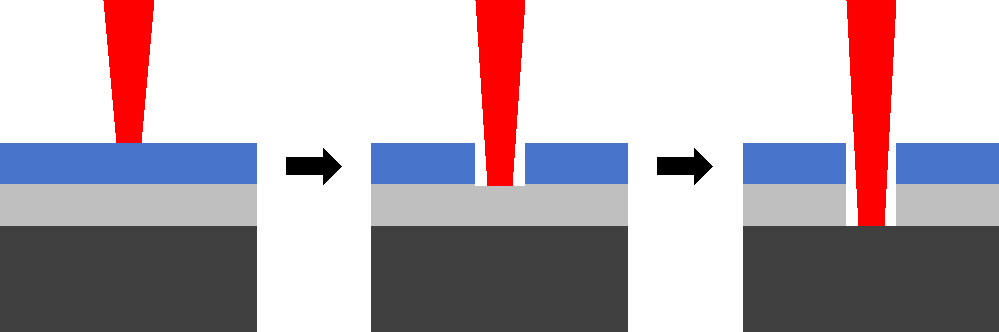
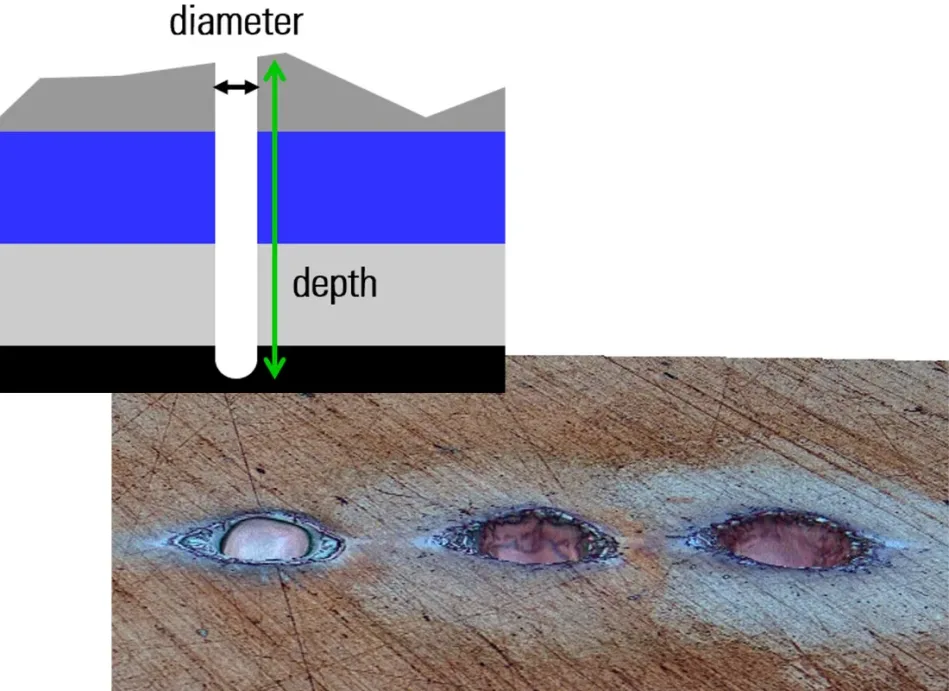
Repeated laser pulses form a controlled microcrater through coatings and intermediate layers to the substrate. This enables elemental characterization from the surface into the material. Samples with coatings or oil films can be analyzed directly without pretreatment.
Multi-Point Elemental Analysis
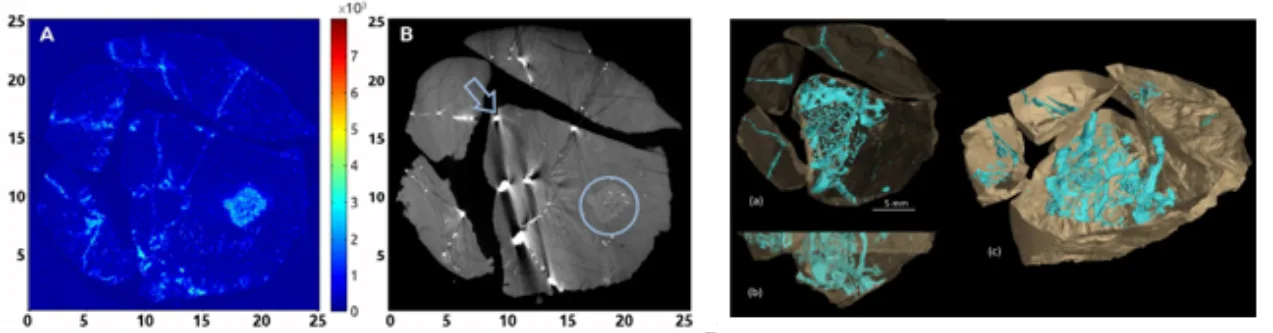
Automated multi-position analysis can characterize a substrate and attached materials, investigate several contaminants on one surface, or compare separate regions of interest. The system analyzes the selected locations in a single workflow, reducing repositioning and repetitive operations while improving throughput, consistency, and accuracy.
Explore the LIBS elemental analyzer range or contact LiSen Optics to discuss microscope integration and your measurement requirements.