Integrated Elemental Analysis
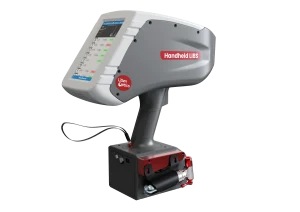
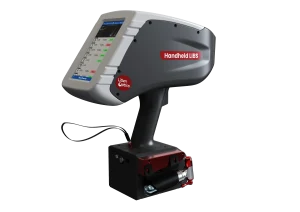
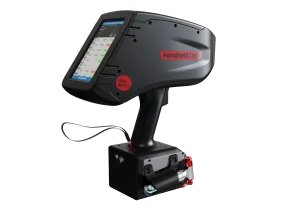
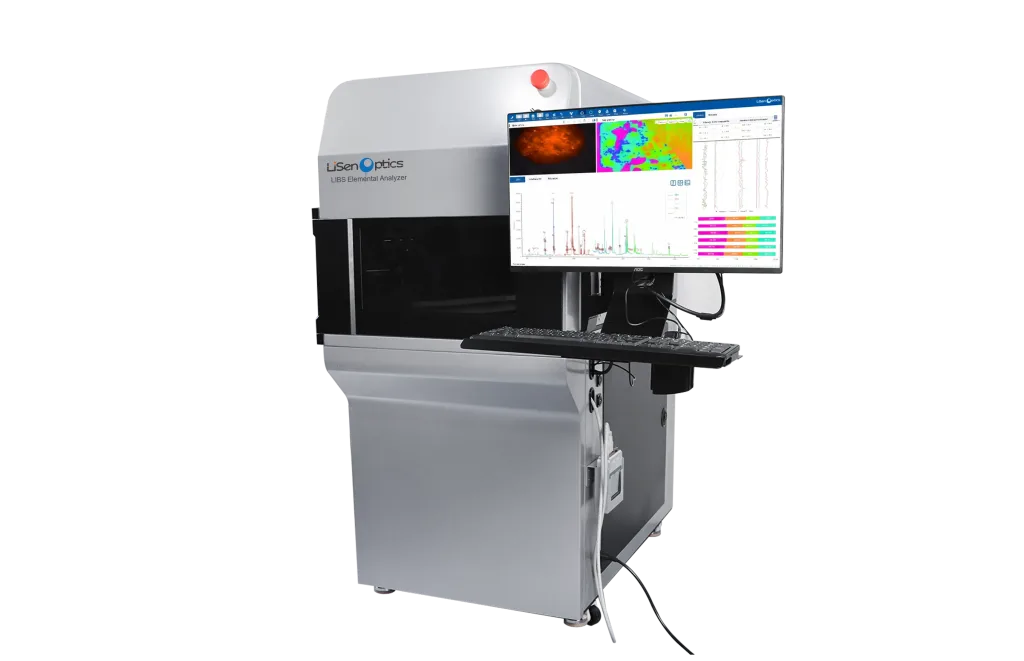
The iSpecLIBS-SCI series brings laser-induced breakdown spectroscopy, high-resolution spectral detection, sample positioning, and acquisition and analysis software together in one platform. The range includes the iSpecLIBS-SCI400, iSpecLIBS-SCI800, and iSpecLIBS-SCI800 PRO, with imaging, positioning, and spectroscopy options that vary by model.
A focused pulsed laser creates a plasma at the sample surface. The system analyzes its emission spectrum to identify elements, classify materials, and perform qualitative, semi-quantitative, and quantitative analysis. Configurations with motorized XYZ positioning, macro and micro imaging, and trigger-delay control support automated measurement workflows. Optional Raman, visible-NIR, and fluorescence modules allow synchronized multimodal acquisition and data-fusion analysis.
Technical Specifications
| Parameter | iSpecLIBS-SCI400 | iSpecLIBS-SCI800 | iSpecLIBS-SCI800 PRO |
|---|---|---|---|
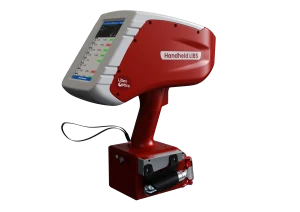
| Product Image |
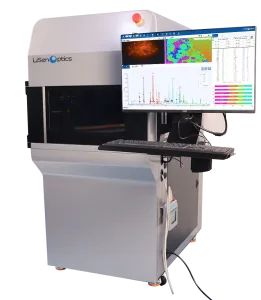 |
|
|
| Elemental Coverage | Elements with atomic number Z ≥ 1, including C, H, and O; light elements such as N, Li, Be, and B; and nearly all metallic and nonmetallic elements | Elements with atomic number Z ≥ 1, including C, H, and O; light elements such as N, Li, Be, and B; and nearly all metallic and nonmetallic elements | Elements with atomic number Z ≥ 1, including C, H, and O; light elements such as N, Li, Be, and B; and nearly all metallic and nonmetallic elements |
| Concentration Range | 10 ppm to percent levels (element- and configuration-dependent) | 10 ppm to percent levels (element- and configuration-dependent) | 10 ppm to percent levels (element- and configuration-dependent) |
| Analysis Time | <1 s | <1 s | <1 s |
| Analysis Modes | Qualitative, semi-quantitative, and quantitative | Qualitative, semi-quantitative, and quantitative | Qualitative, semi-quantitative, and quantitative |
| Sample Types | Metals and alloys, minerals, gemstones, ceramics, semiconductor materials, fossil fuels, soils, plants, traditional herbal medicines, and other solid composites. Powder samples such as metal, mineral, and pharmaceutical powders may be analyzed after pelletizing. Supports major, minor, light, and trace-element analysis with minimal sample preparation. | Metals and alloys, minerals, gemstones, ceramics, semiconductor materials, fossil fuels, soils, plants, traditional herbal medicines, and other solid composites. Powder samples such as metal, mineral, and pharmaceutical powders may be analyzed after pelletizing. Supports major, minor, light, and trace-element analysis with minimal sample preparation. | Metals and alloys, minerals, gemstones, ceramics, semiconductor materials, fossil fuels, soils, plants, traditional herbal medicines, and other solid composites. Powder samples such as metal, mineral, and pharmaceutical powders may be analyzed after pelletizing. Supports major, minor, light, and trace-element analysis with minimal sample preparation. |
| Spectrometer | Four-channel spectrometer: 180-810 nm; resolution ≤0.2 nm | Four-channel spectrometer: 180-810 nm; resolution ≤0.2 nm | Eight-channel spectrometer: 180-1045 nm; resolution ≤0.2 nm |
| Nd:YAG Laser | Standard: 1064 nm, 100 mJ; other configurations available | Standard: 1064 nm, 100 mJ; other configurations available | Standard: 1064 nm, 100 mJ; other configurations available |
| Laser Energy Control | Manual | Motorized | Motorized |
| Stage Travel | 40 × ±25 × 110 mm | 50 × 50 × 75 mm | 50 × 50 × 75 mm |
| Stage Positioning Accuracy | Manual positioning; minimum readout 0.01 mm | Automatic positioning; up to 2 µm | Automatic positioning; up to 0.5 µm |
| Stage Functions | No | Mapping scans and user-selected point measurements; automatic autofocus of the excitation-and-collection probe | Mapping scans and user-selected point measurements; automatic autofocus of the excitation-and-collection probe |
| Sample Imaging [1] | No | Yes | Yes |
| Macro Imaging [2] | No | Yes | Yes |
| Micro Imaging [3] | No | Yes | Yes |
| Multimodal Spectroscopy Module (Optional) | No | Raman / Vis-NIR / Fluorescence | Raman / Vis-NIR / Fluorescence |
| Analysis Spot Size | ≤1 mm | Down to 15 µm | Down to 15 µm |
| Working Distance | 45 mm | 45 mm | 45 mm |
| Spectral Acquisition and Analysis Software | Basic | Professional | Professional |
| Purge | Inert-gas purge (optional) | Inert-gas purge (optional) | Inert-gas purge (optional) |
| Laser Output Direction | Vertical | Vertical | Vertical |
| Measurement Position | At the focal point | At the focal point | At the focal point |
| Safety | No radioactive source; integrated laser emergency-stop system | No radioactive source; integrated laser emergency-stop system | No radioactive source; integrated laser emergency-stop system |
| Operating Temperature | 5-35 °C | 5-35 °C | 5-35 °C |
| Dimensions | 600 × 300 × 1026 mm | 600 × 300 × 1026 mm | 600 × 300 × 1026 mm |
| Sample imaging configuration [1] | No | Dual-lens, dual-camera configuration for micro-area and macro-area observation. | Dual-lens, dual-camera configuration for micro-area and macro-area observation. |
| Macro imaging details [2] | No | Wide-angle color camera; 2448 × 2048 pixels; 50 × 50 mm field of view; 2/3-inch CMOS sensor. | Wide-angle color camera; 2448 × 2048 pixels; 50 × 50 mm field of view; 2/3-inch CMOS sensor. |
| Micro imaging details [3] | No | Monochrome camera for precision positioning; 2600 × 2160 pixels; 12× continuous-zoom optical path; up to 50× micro-area imaging; 45 mm focal length; NA 0.15; laser spot down to 15 µm; optional LED illumination and point-selection measurement. | Monochrome camera for precision positioning; 2600 × 2160 pixels; 12× continuous-zoom optical path; up to 50× micro-area imaging; 45 mm focal length; NA 0.15; laser spot down to 15 µm; optional LED illumination and point-selection measurement. |
Modular System Design
The laser, motorized XYZ stage, multichannel spectrometers, excitation-and-collection probe, and macro and micro imaging modules can be configured for the application. Core modules support automated software control. Optional multiscale visual navigation, precision autofocus, mapping, and infrared spectroscopy extend the platform into an automated analytical workstation.
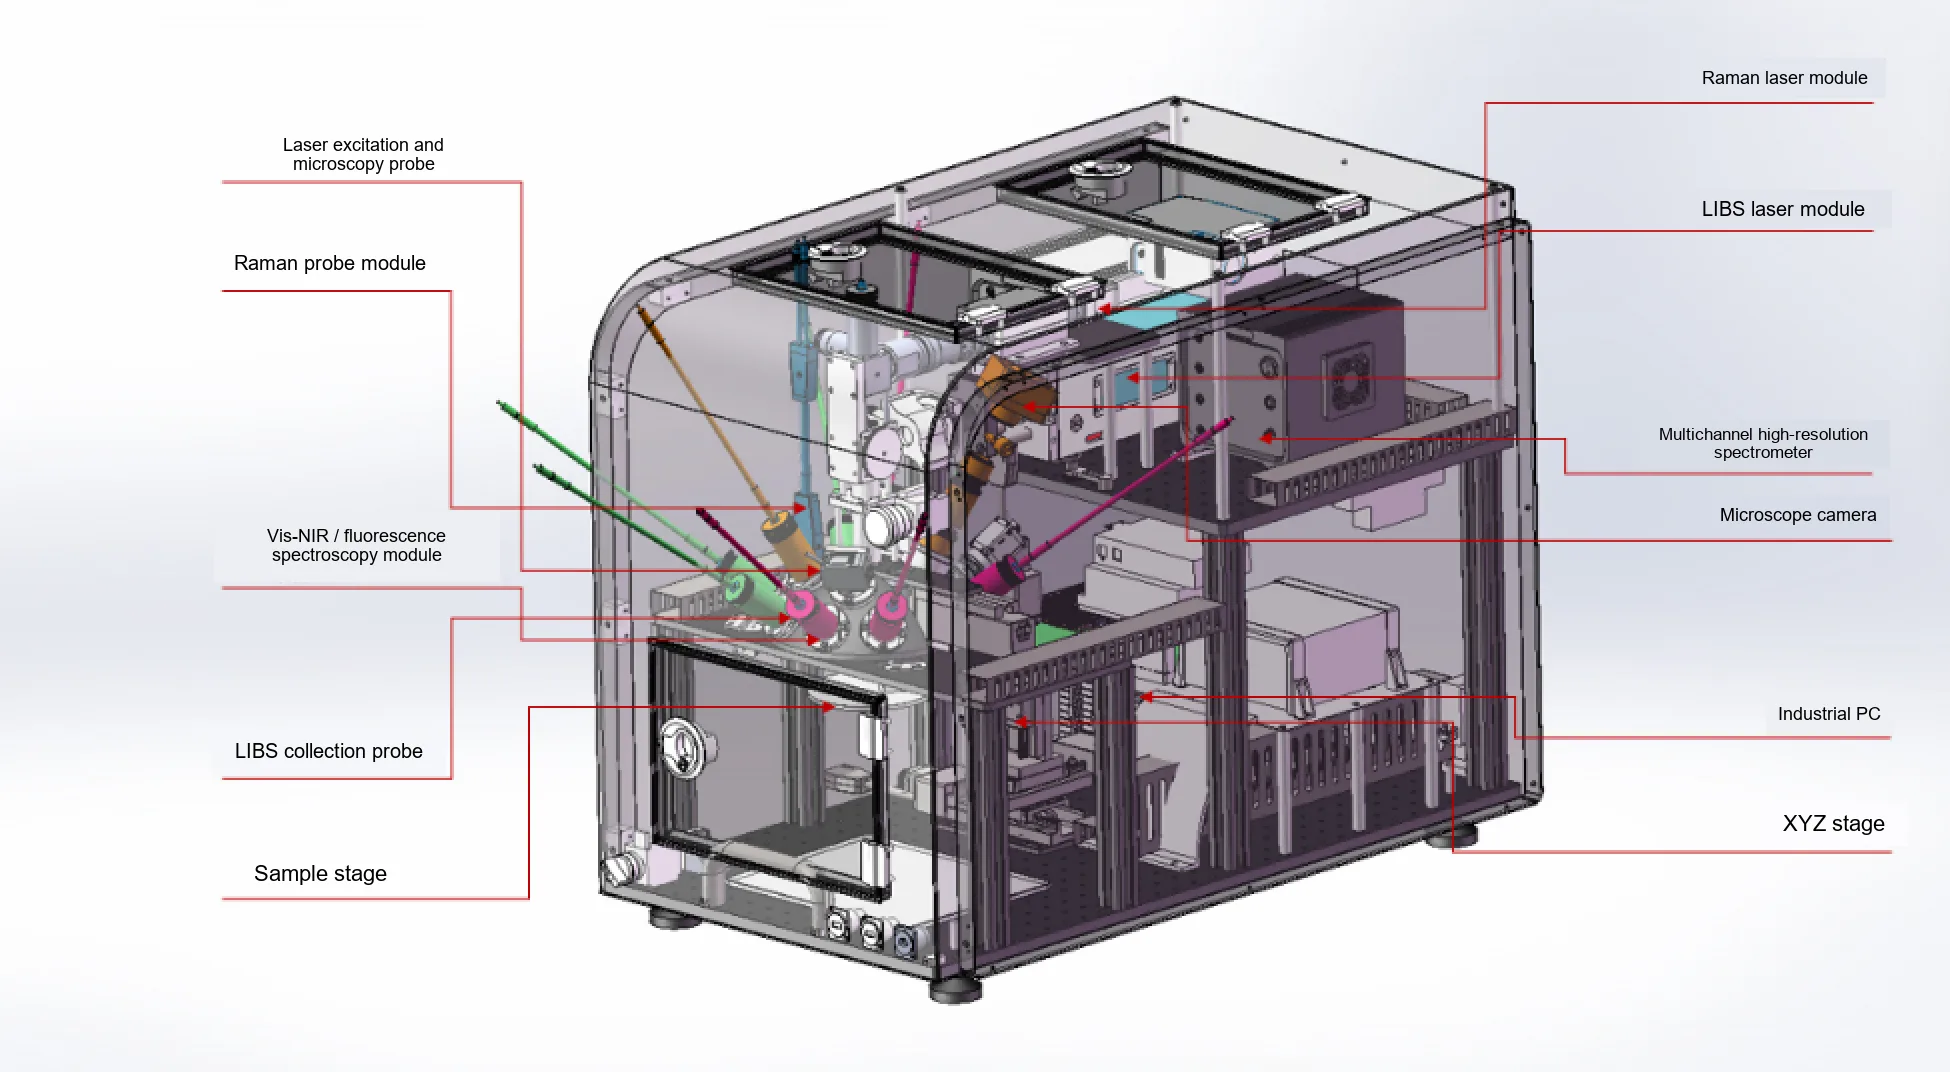
LIBS can be combined with Raman, visible-NIR, and fluorescence spectroscopy for synchronized acquisition and multimodal data fusion.
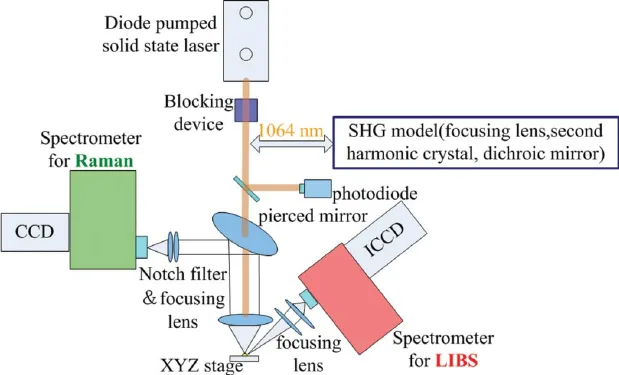
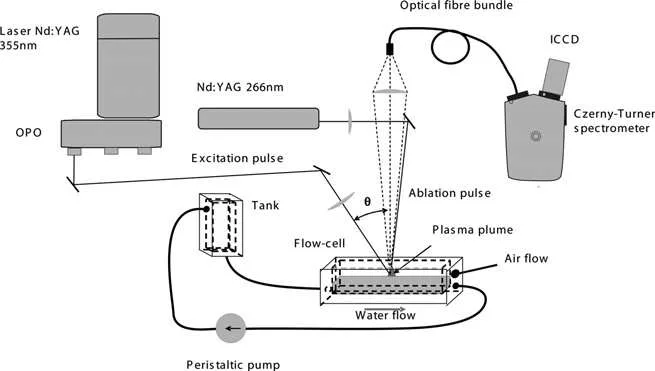
LIBS Operating Principle
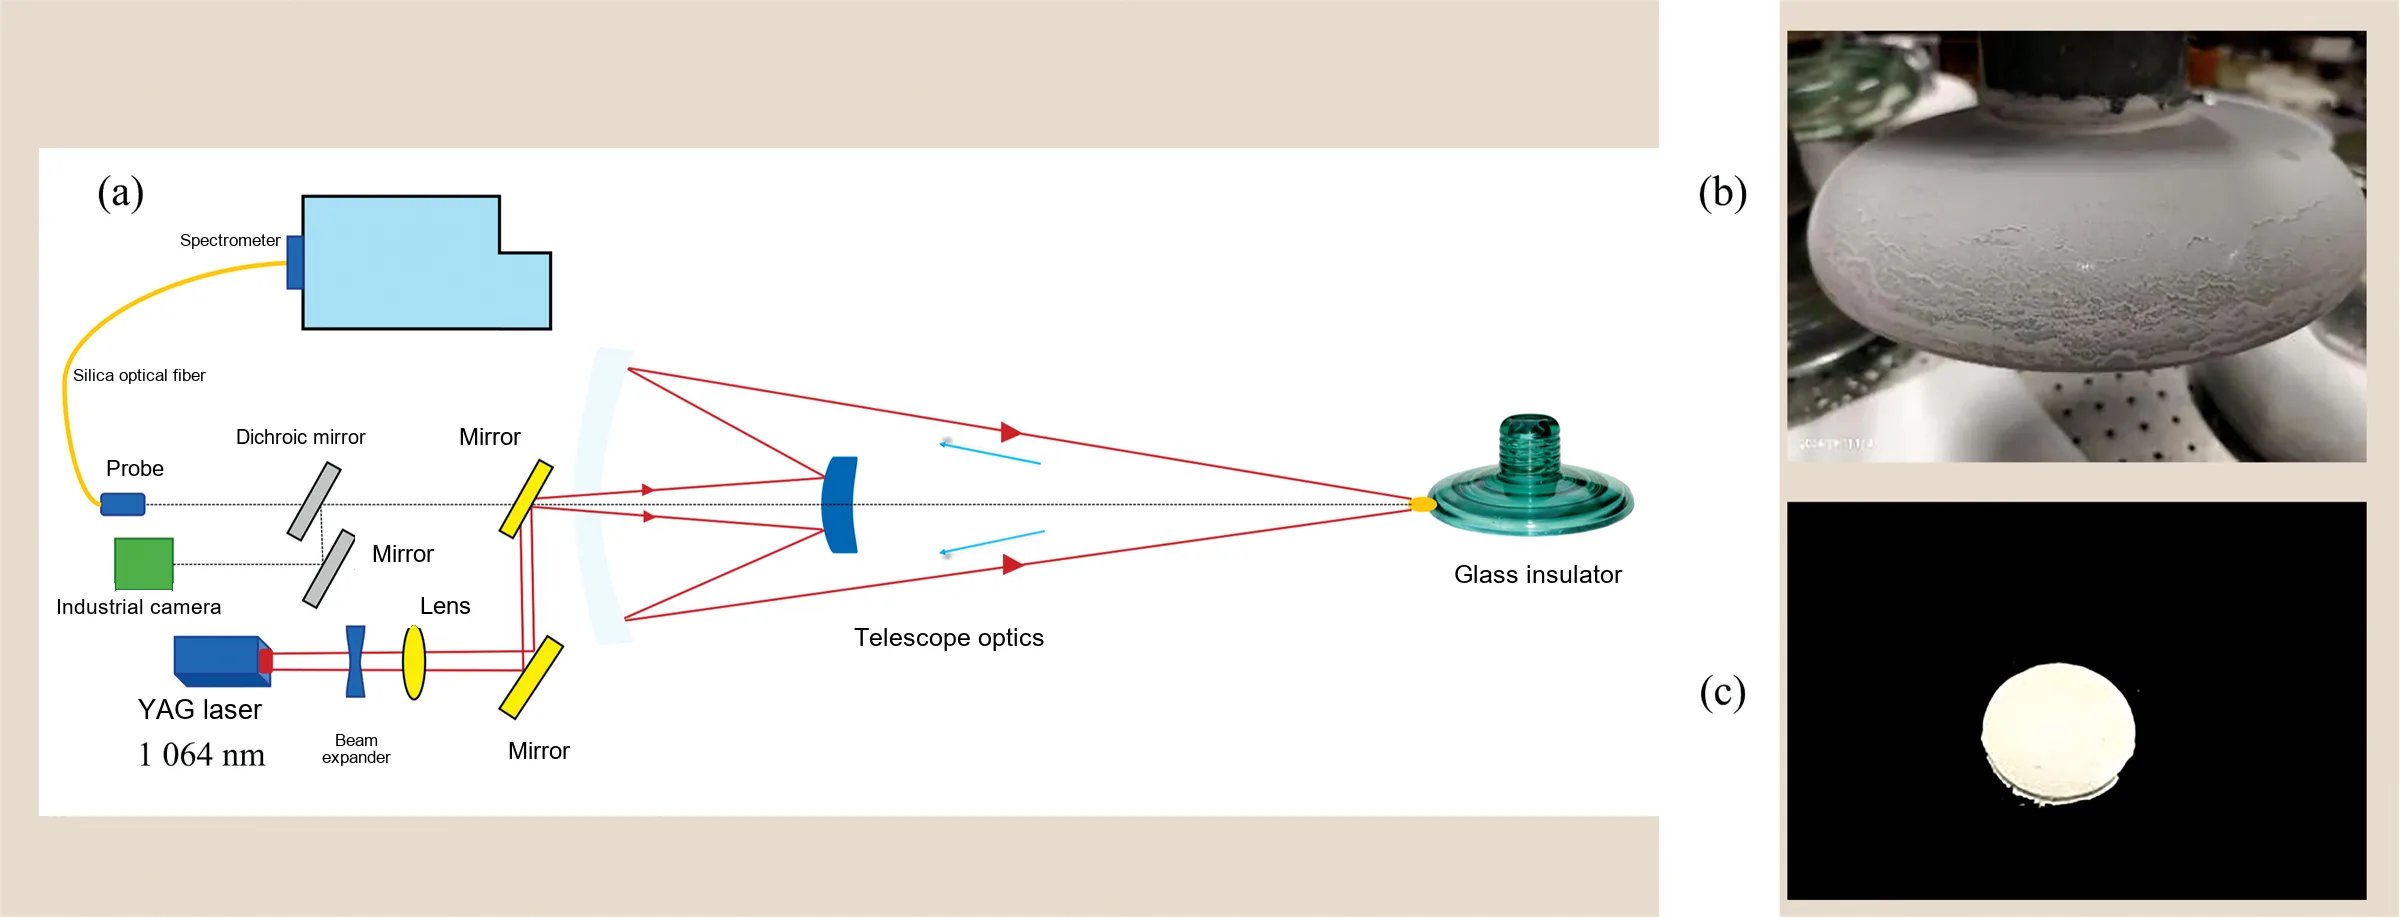
A pulsed laser is focused onto the sample to generate a plasma. Collection optics direct the emitted light to the spectrometer, where characteristic emission lines reveal the elements present. The system requires little to no sample preparation, supports millisecond-scale spectral acquisition, and uses no chemical reagents.
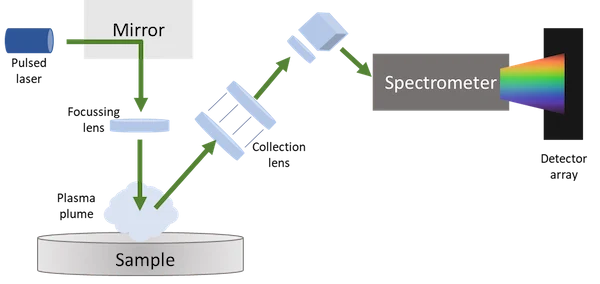
Available measurement workflows range from individual points to programmed scans. Supported configurations enable micrometer-scale depth profiling and three-dimensional elemental mapping, with targeted analysis of both microscopic regions and larger sample areas.
Typical LIBS Detection Limits
LIBS covers nearly the entire periodic table, including light elements such as C, H, O, N, Li, Be, and B. Typical detection limits for many elements fall in the 10–100 ppm range. The source lists the following representative limits:
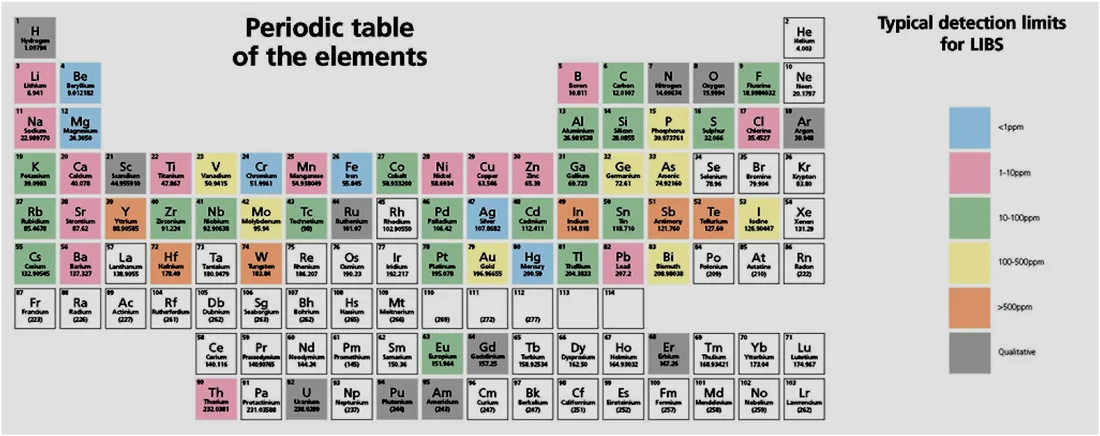
- Li, Be, B, Na, Mg, Al, K, and Ca: approximately 10 ppm (0.001%).
- Ti, V, Cr, Mn, Fe, Co, Ni, Cu, Zn, and Mo: approximately 100 ppm (0.01%).
- C, N, O, P, and Si: approximately 200 ppm (0.02%).
- F, Cl, Br, and S: approximately 0.5%.
Actual detection limits depend on the element, sample matrix, and measurement conditions.
Spectral Acquisition and Analysis Software
The software provides acquisition, spectral processing, elemental identification, concentration prediction, and quantitative calibration functions. Calibration can use peak height, peak area, peak-height ratios, and peak-area ratios. Feature availability depends on the software edition, as shown in the supplied comparison below.
| Software Function | iSpecLIBS-STD Basic | iSpecLIBS-SCI Professional |
|---|---|---|
| LIBS spectral data acquisition | Yes | Yes |
| Pulse-trigger delay generator control | Yes | Yes |
| Dual-laser aiming, image-based focusing, and synchronized XYZ-stage control | No | Yes |
| Camera image acquisition and display | No | Yes |
| User-defined integration time, number of averages, and trigger delay | Yes | Yes |
| User-defined laser pulse energy and repetition rate | Yes | Yes |
| Real-time dynamic autofocus and fixed-focus operation | No | Yes |
| Preview, save, and analyze spectra from multiple sample types | Yes | Yes |
| Automatic peak detection and elemental identification with real-time reference-line comparison | Yes | No |
| Programmable mapping scans with configurable integration time, trigger delay, and laser energy; supports up to 10,000 scan points | No | Yes |
| Spectral preprocessing, including background correction, baseline correction, and peak-intensity normalization | No | Yes |
| Environmental and matrix-effect correction to improve quantitative reliability | No | Yes |
| Simultaneous multi-element analysis with spectral deconvolution for overlapping emission lines | No | Yes |
| User-defined calibration modeling with linear or polynomial fitting, peak ratios, peak-area calculations, and configurable analyte/background models | No | Yes |
| Results export and validation reports, including elemental concentrations, uncertainty estimates, and statistical significance analysis | No | Yes |
| Interface for advanced machine-learning and deep-learning algorithms to improve identification and quantitative performance | No | Yes |
| Image-recognition workflow for automatic region segmentation, autofocus, point-by-point analysis, and elemental concentration mapping | No | Yes |
Edition note: The source comparison lists automatic peak detection and elemental identification with reference-line comparison as available in Basic and unavailable in Professional. That entry is retained as supplied.
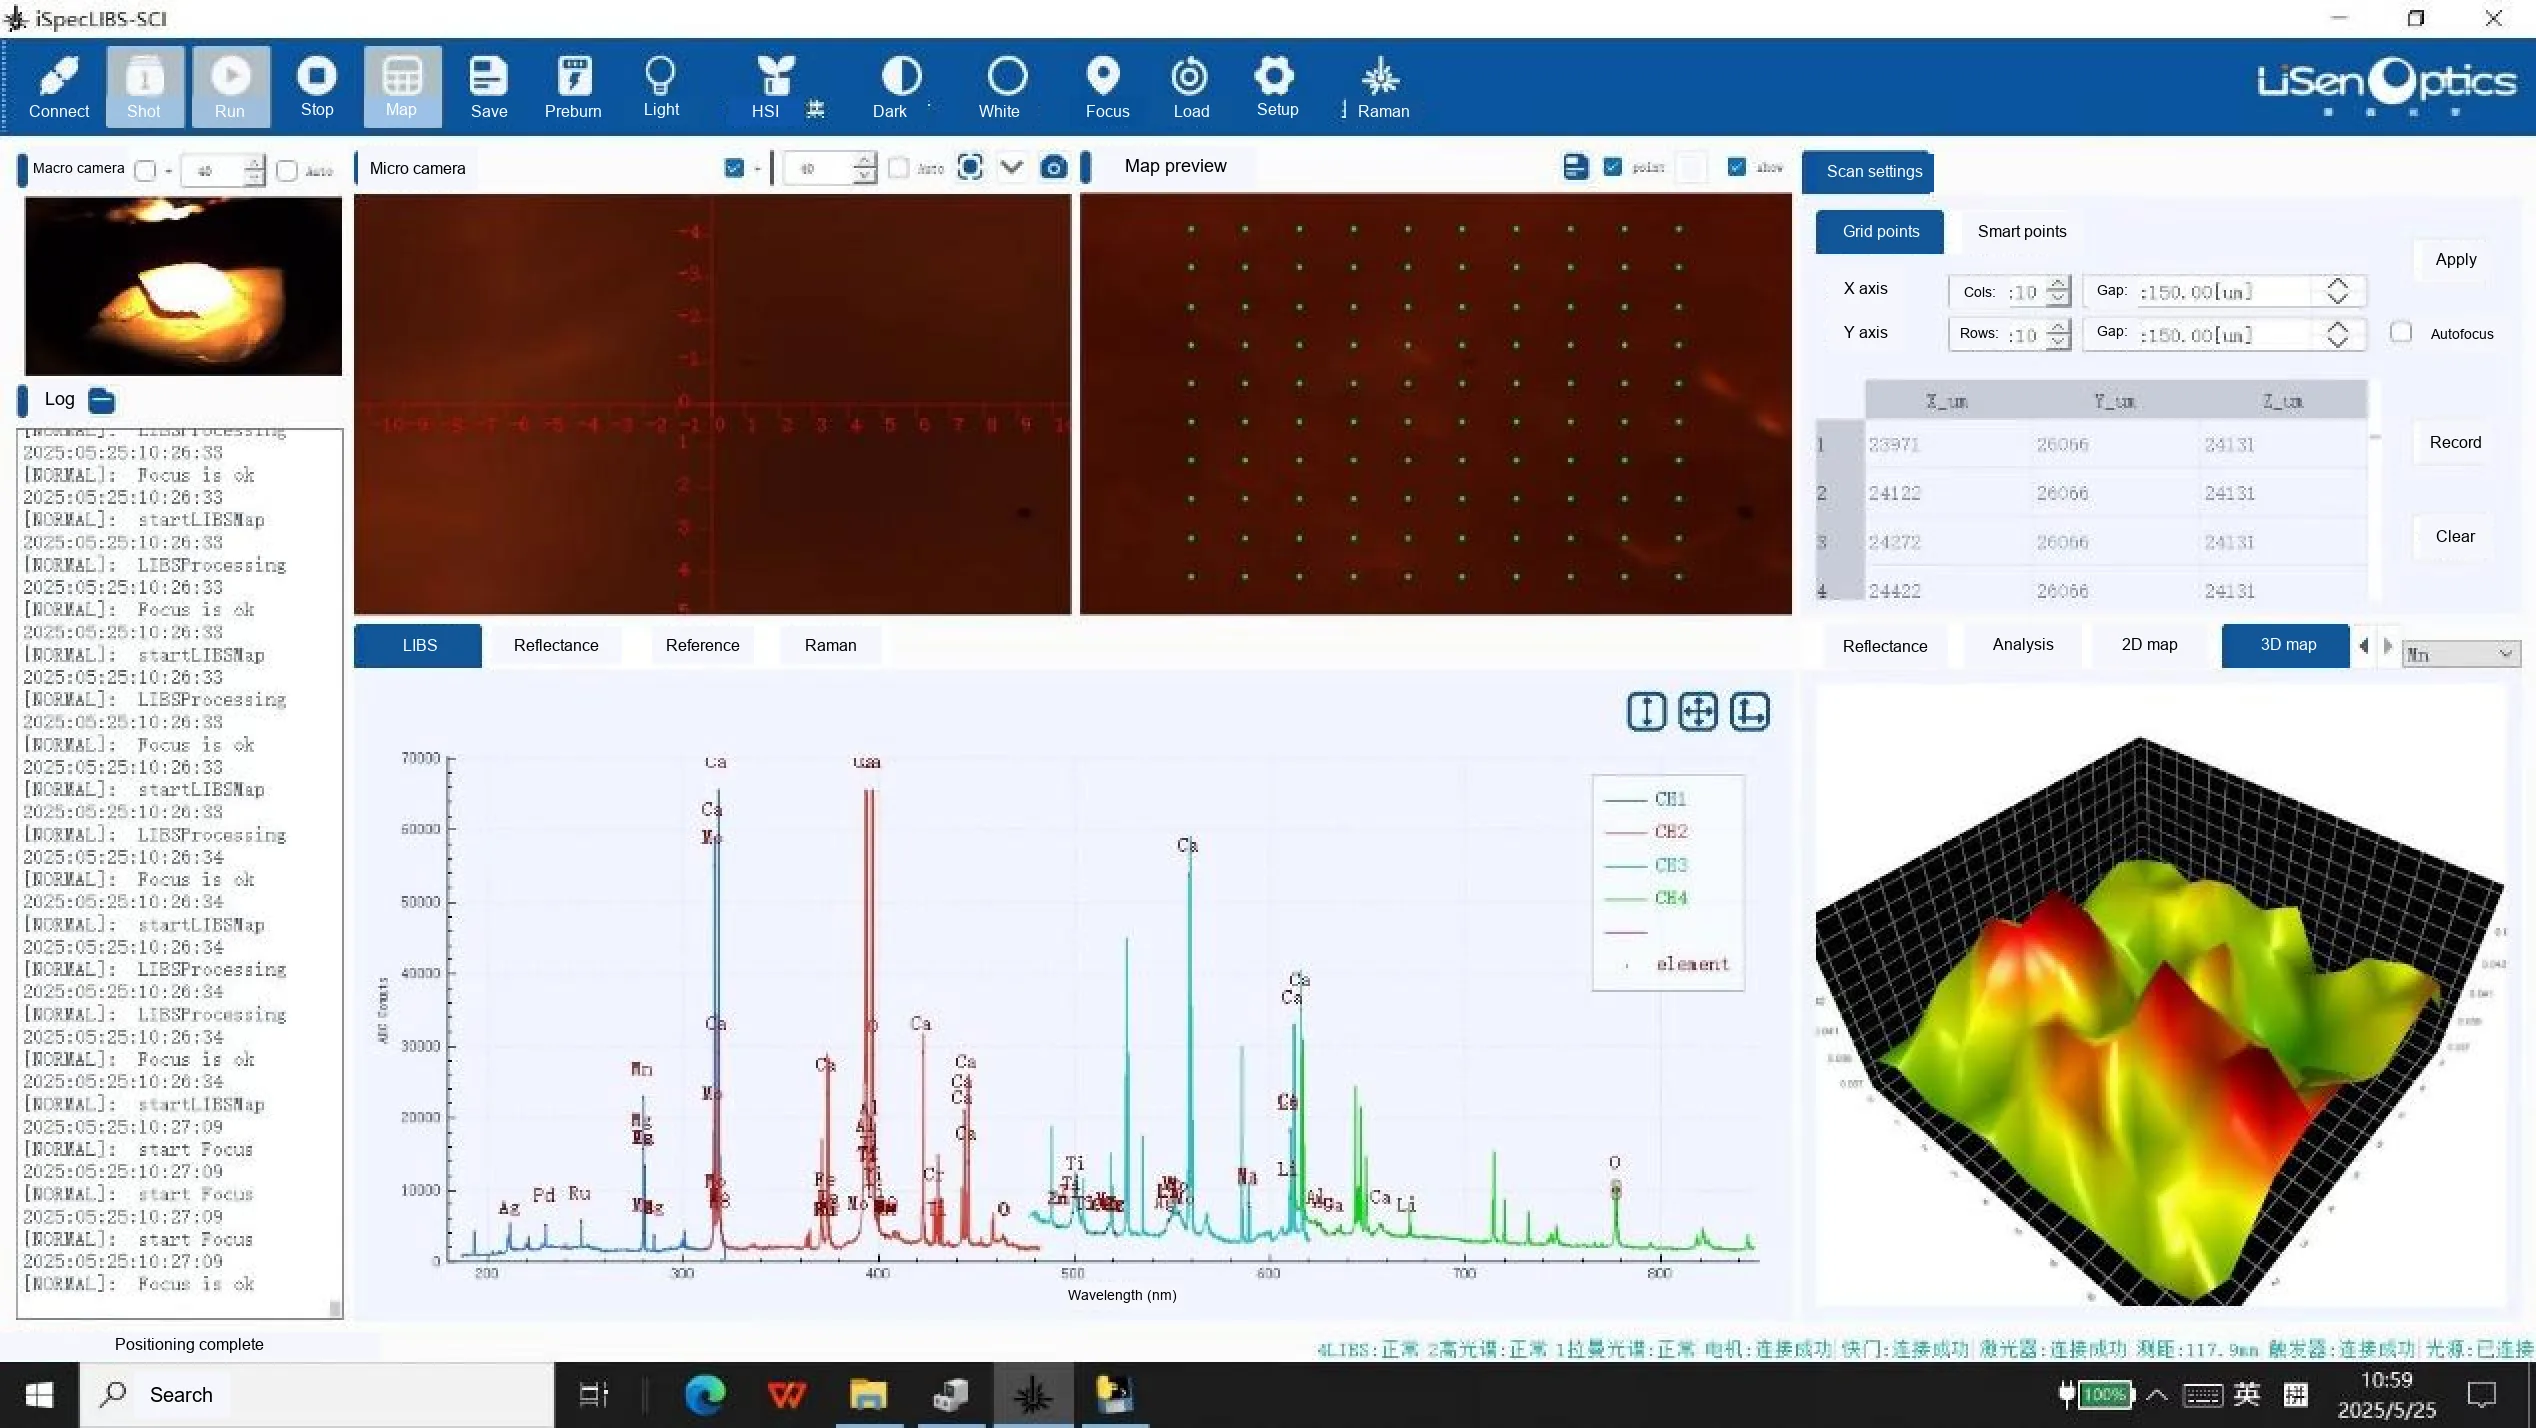
Elemental and Mineral Mapping
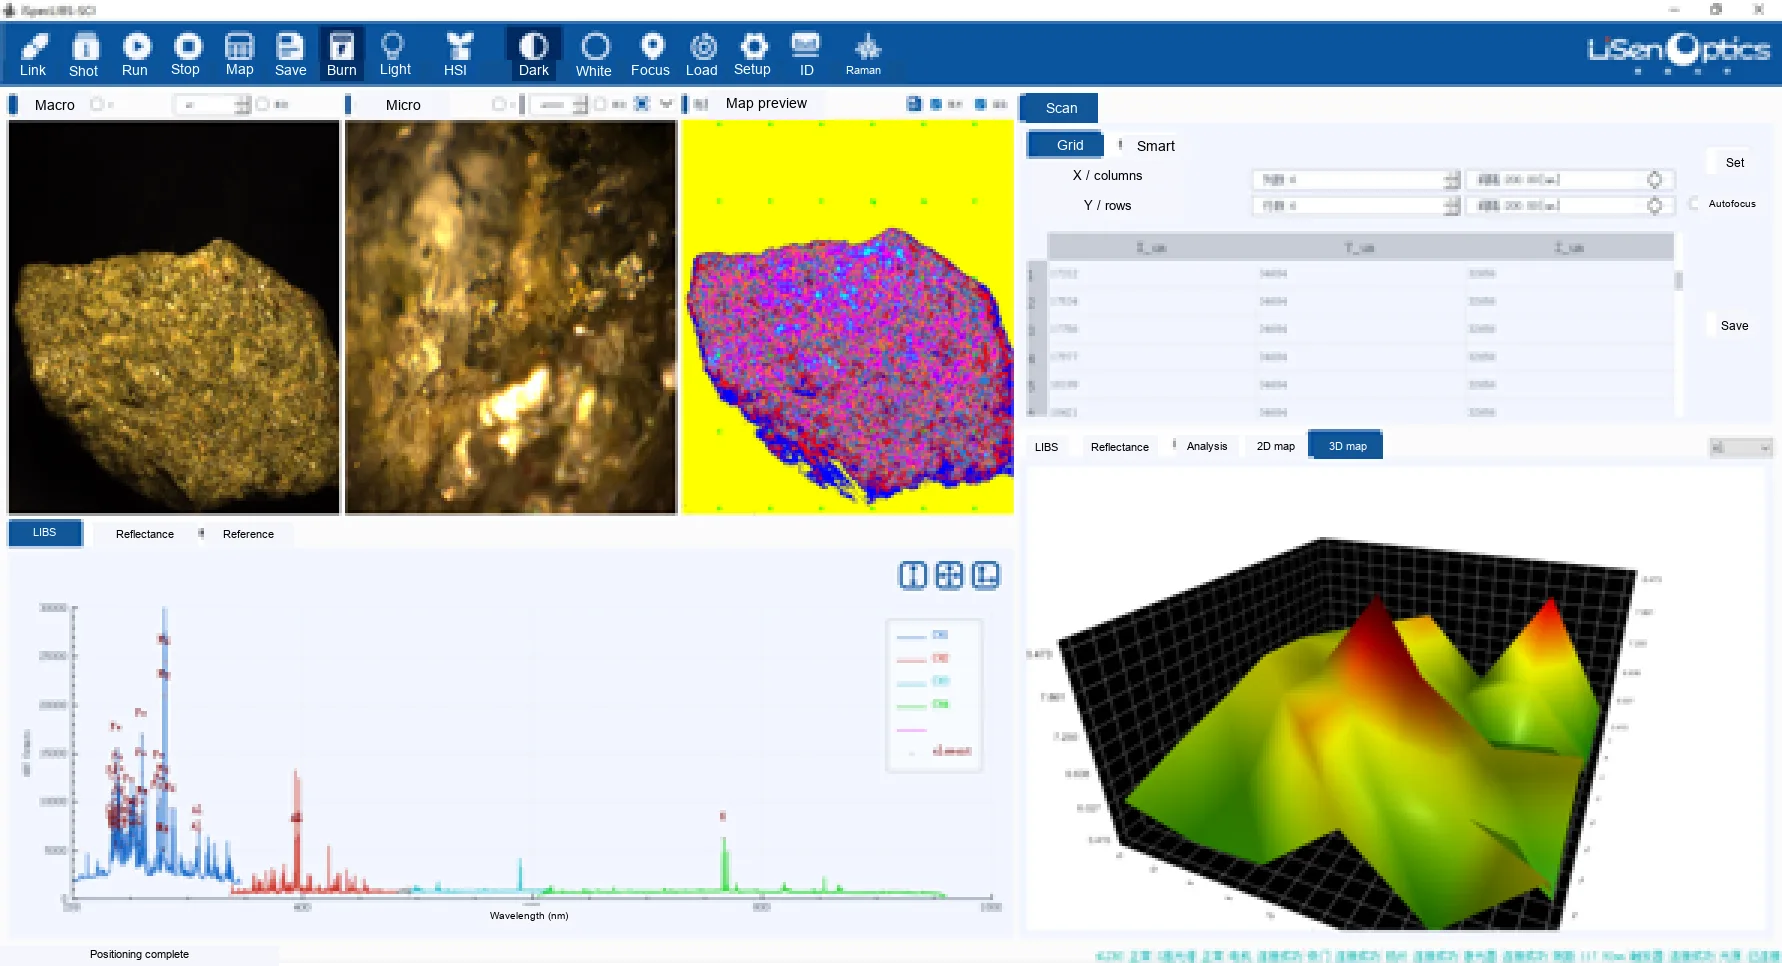
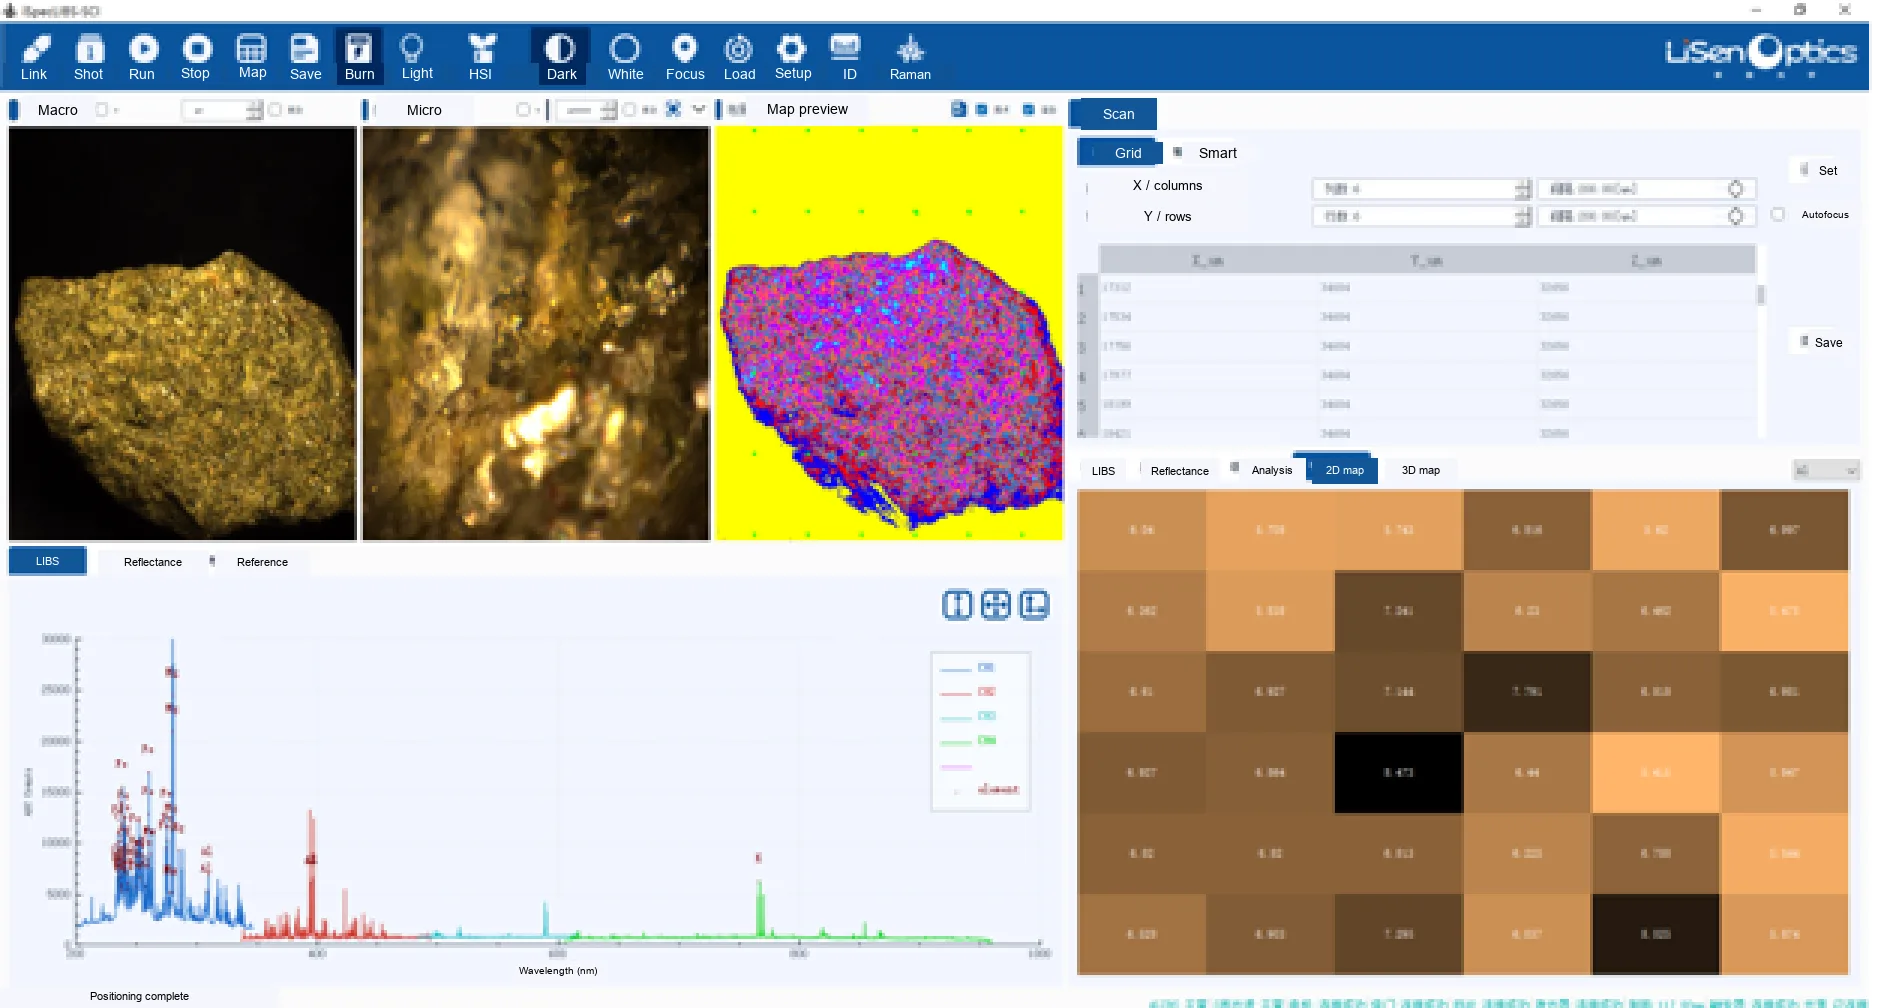
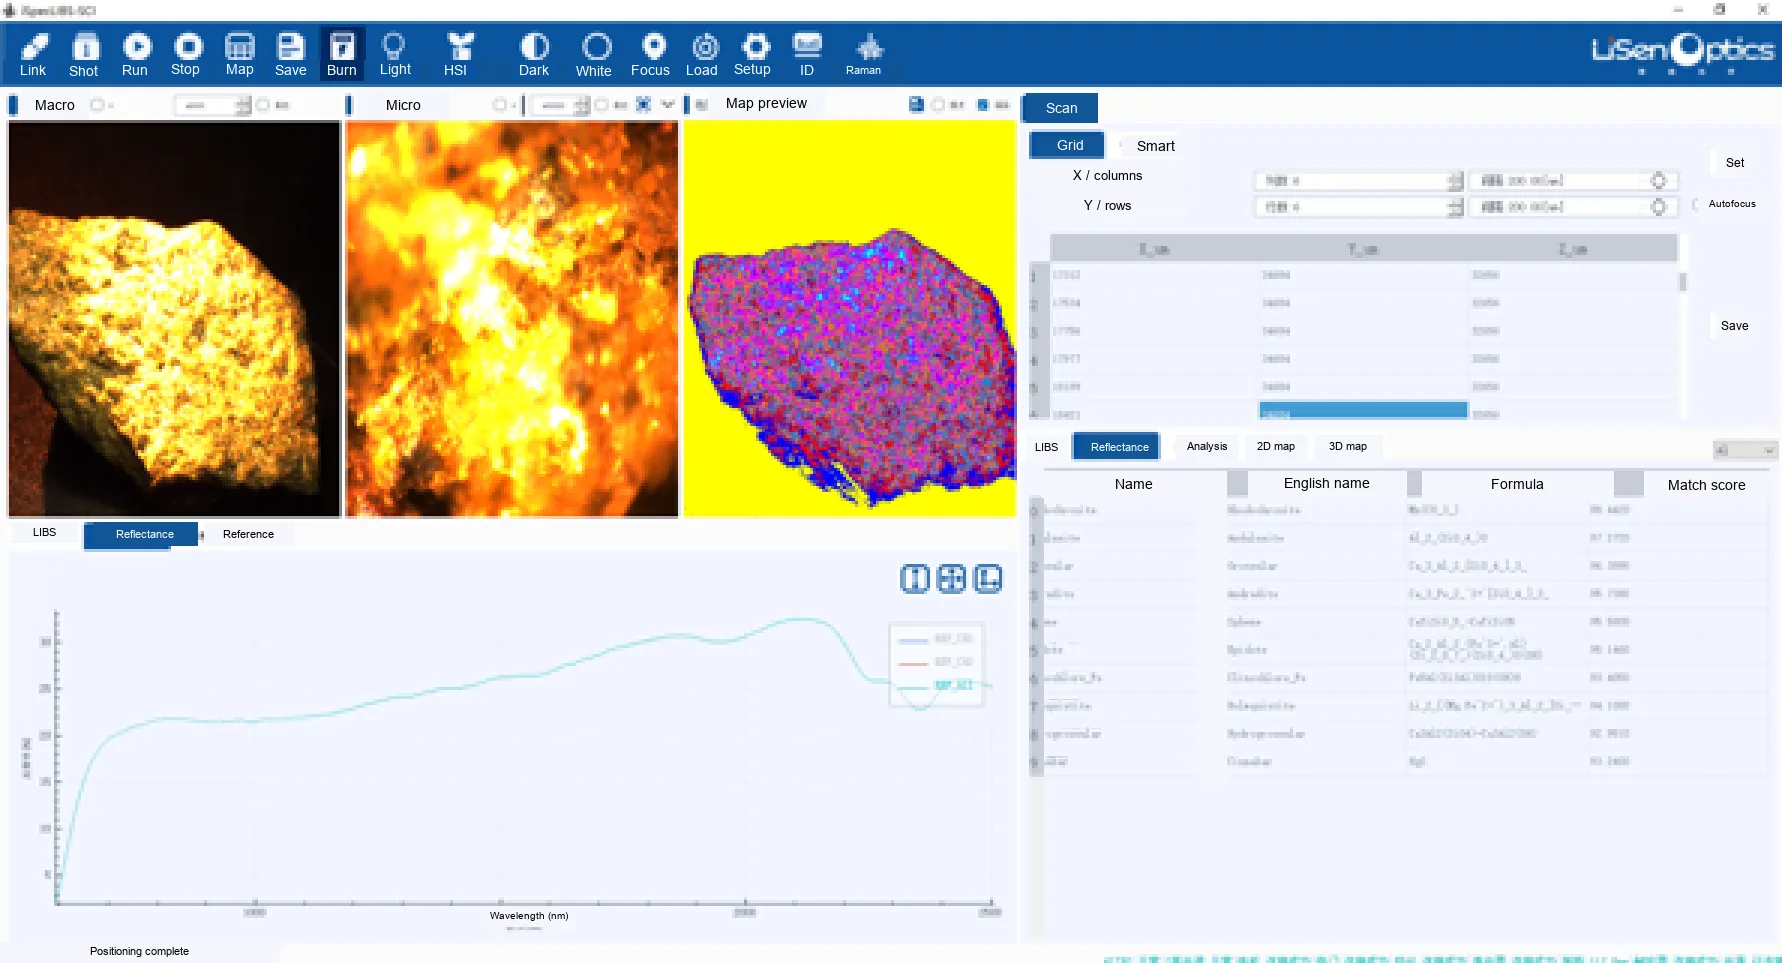
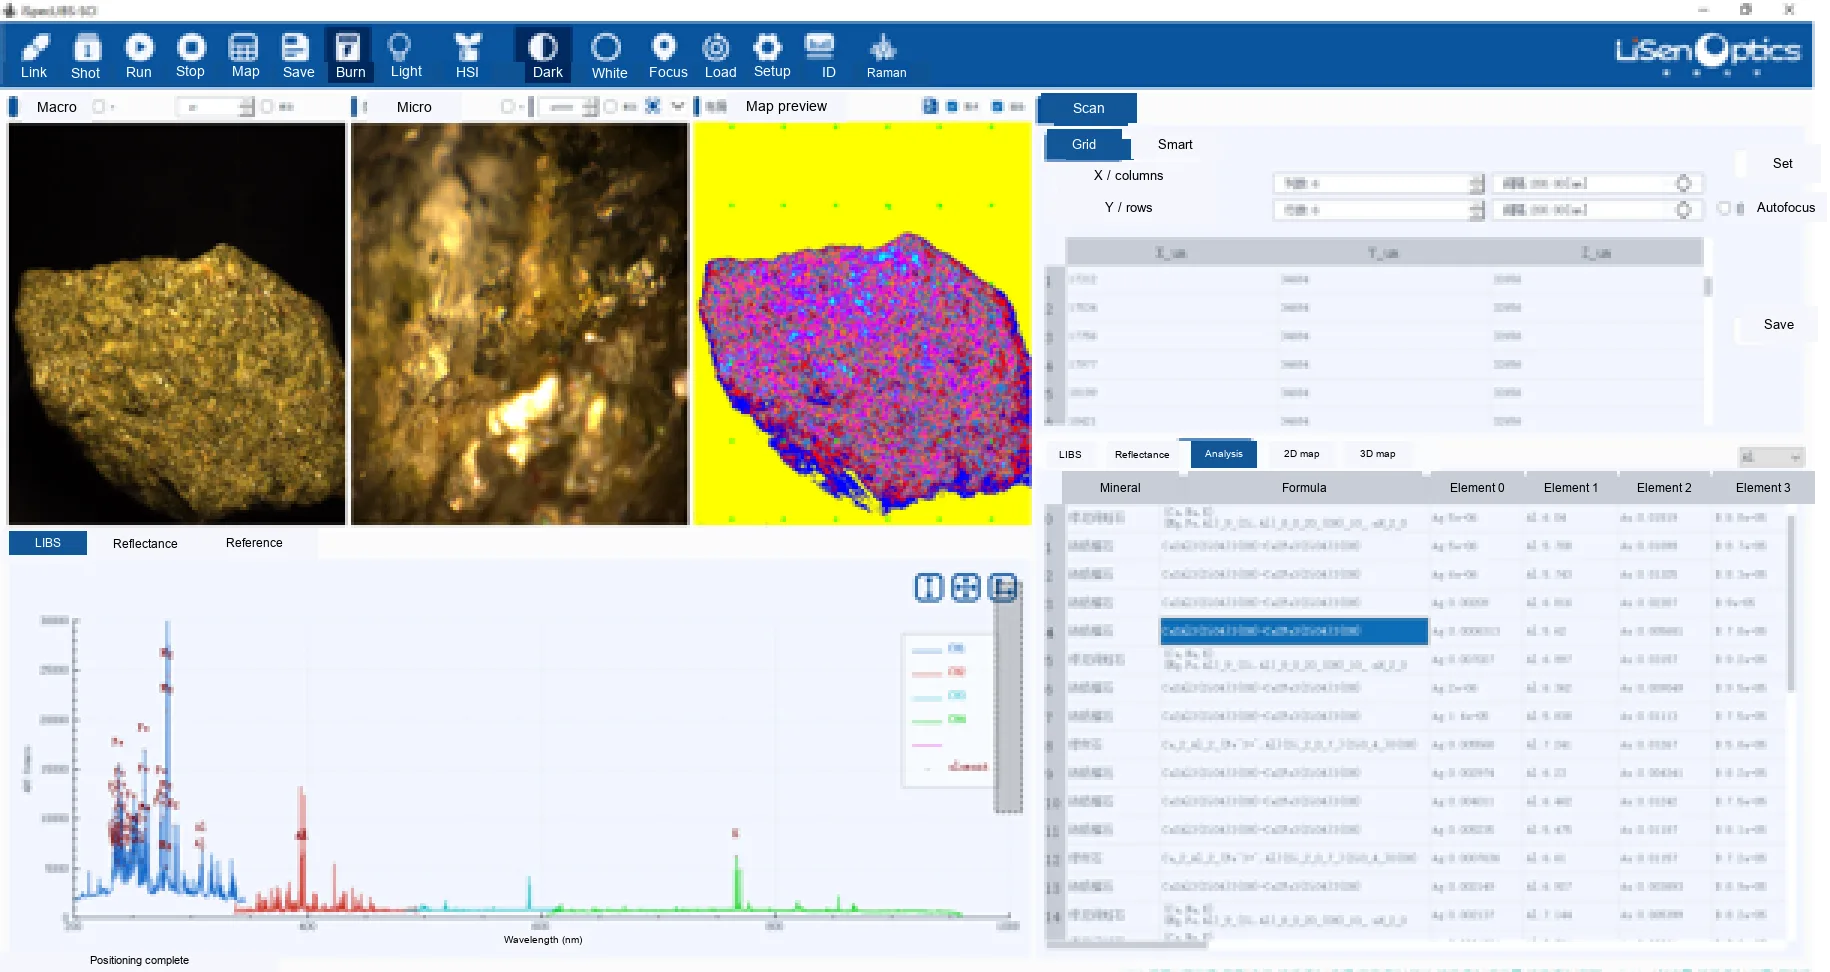
Professional workflows include programmable scans, image-based region selection, autofocus, and point-by-point analysis. The examples below show three-dimensional concentration maps, elemental distribution maps, reflectance hyperspectral mineral identification, and image-based mineral mapping.
Case Study in Geological Exploration
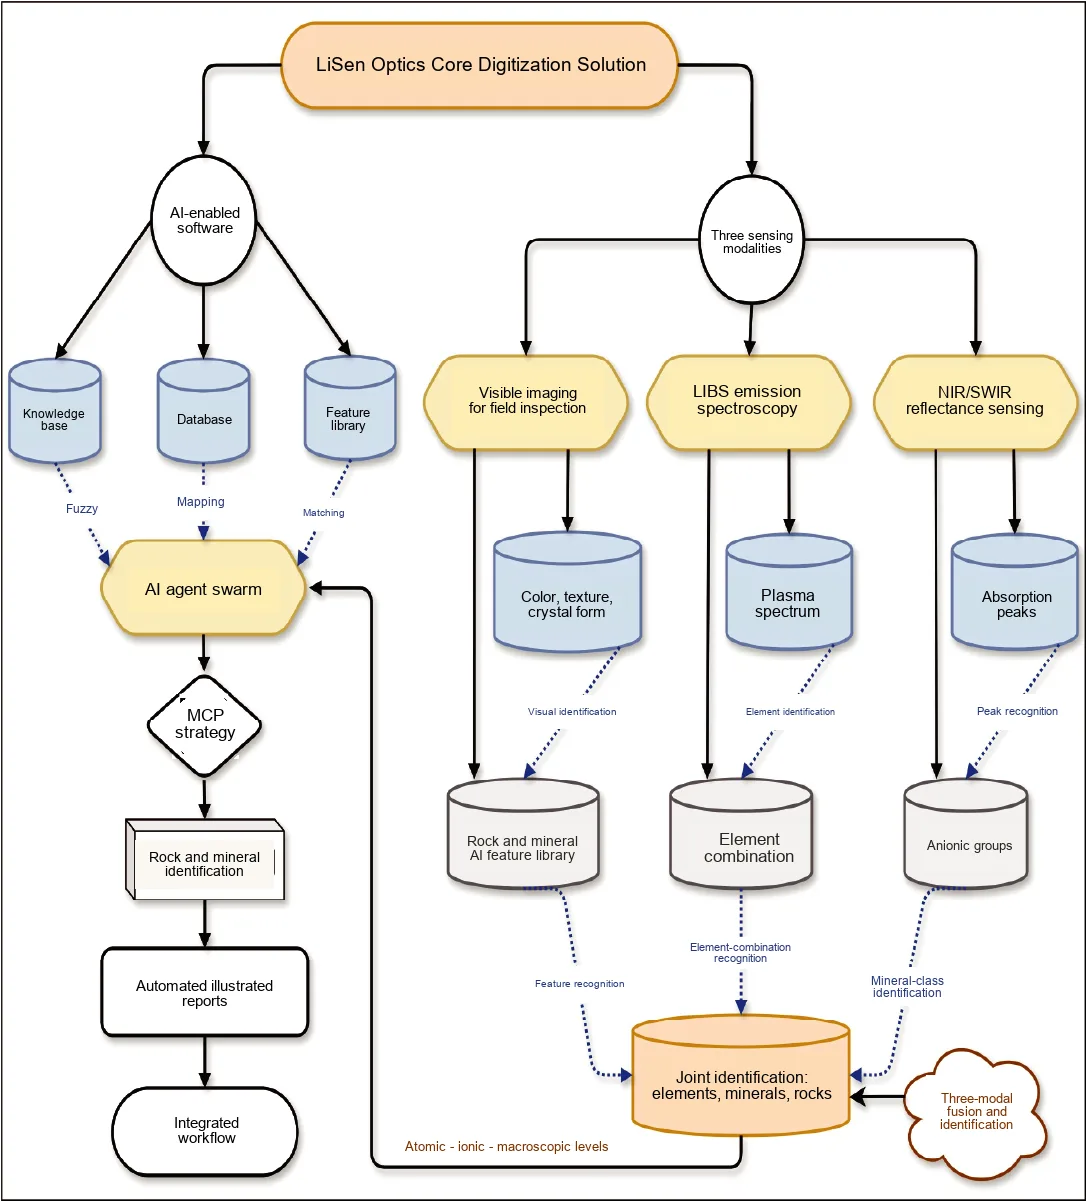
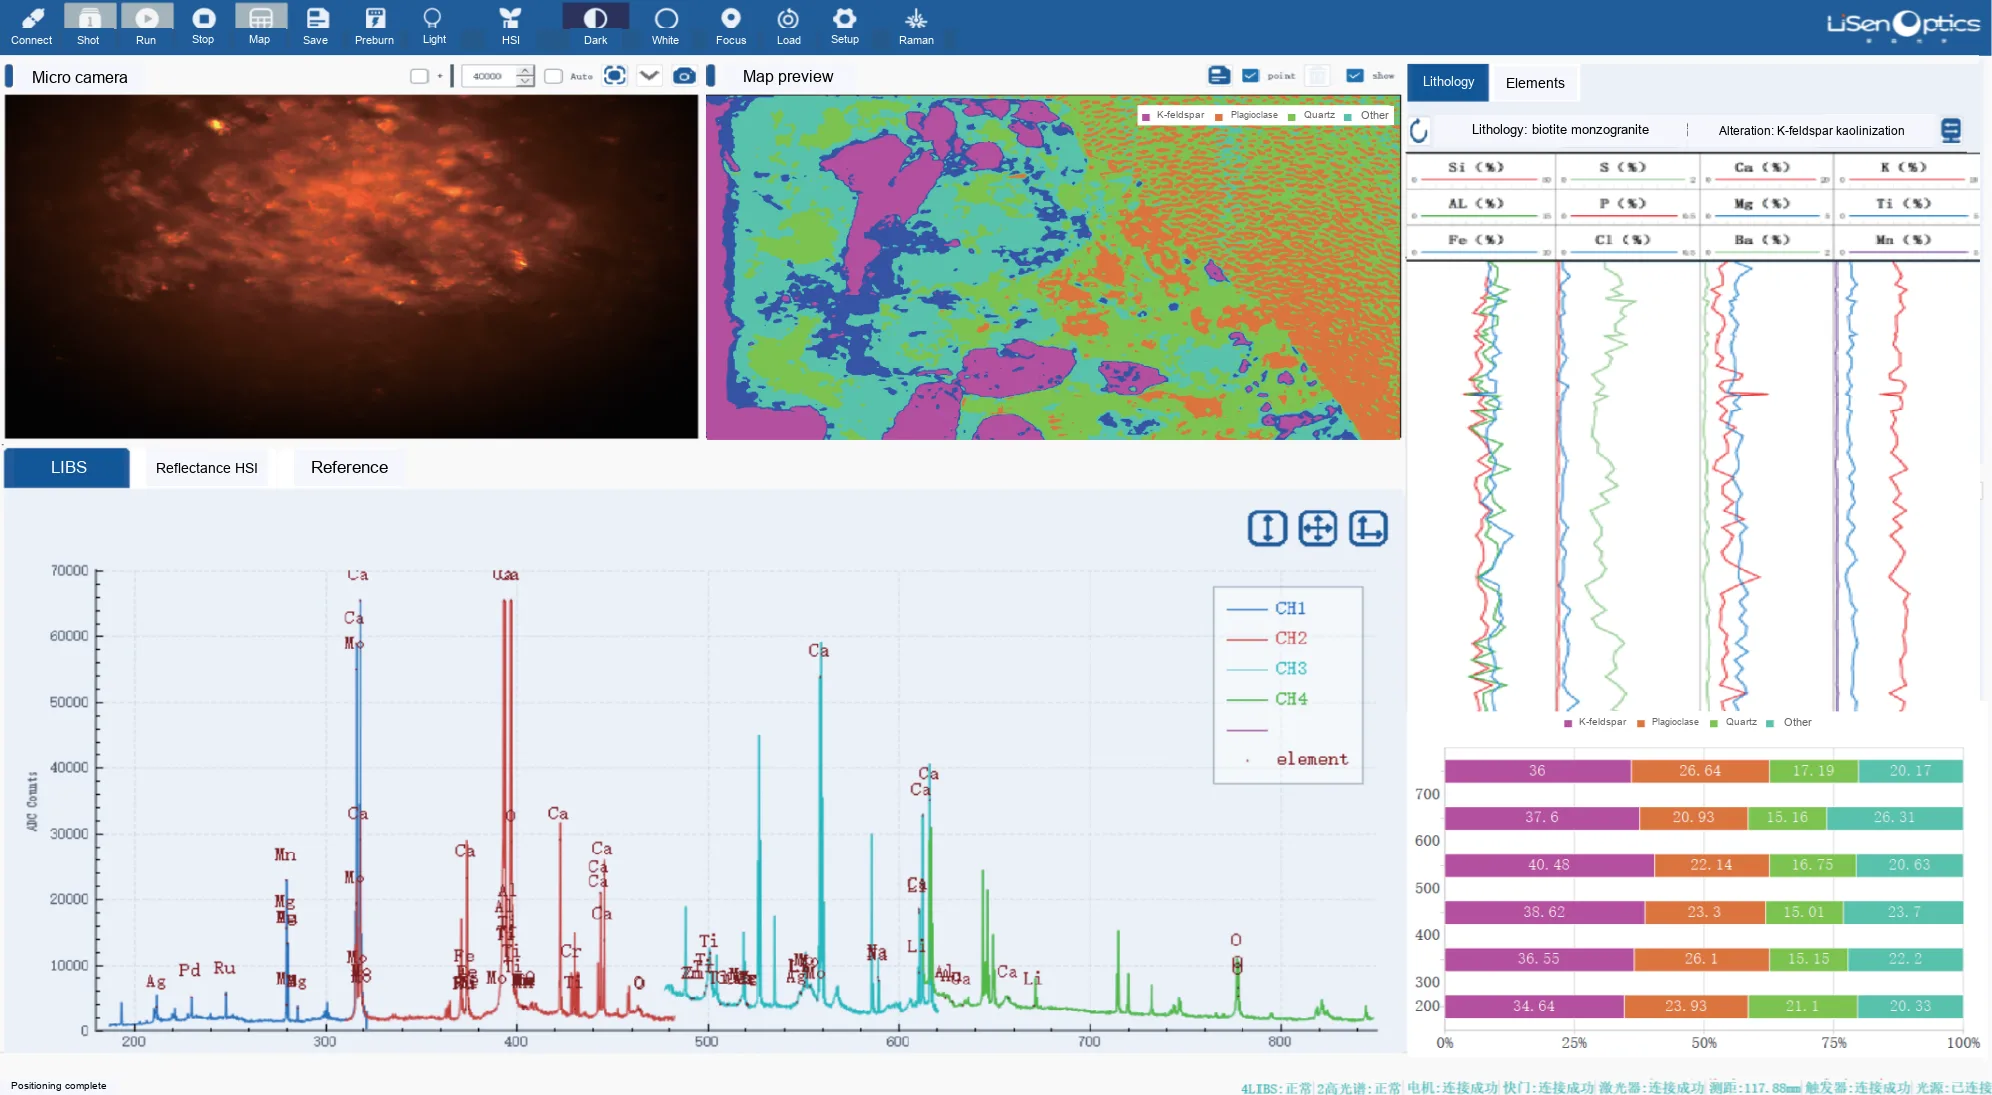
The LiSen Optics Core Digitization Solution combines LIBS, infrared hyperspectral imaging, and visible-light imaging in a workflow from core data acquisition to intelligent interpretation. Its four stages are hardware sensing, feature extraction, multimodal data fusion, and results generation.
The integrated software provides a single workspace for multimodal acquisition, visualization, and identification. Microscopic imaging, spectral acquisition, mineral distribution mapping, and lithology and elemental identification are performed in the same interface. Combining qualitative rock and mineral identification with quantitative elemental concentrations and proportions reduces tool switching and supports faster, more accurate core interpretation.
Applications
Elemental Analysis
LIBS supports quantitative trace-element analysis across a wide range of materials, including chromium in steel, magnesium in aluminum alloys, iron in glass, and copper in copper sulfate.
Ore Grade Analysis and Sorting
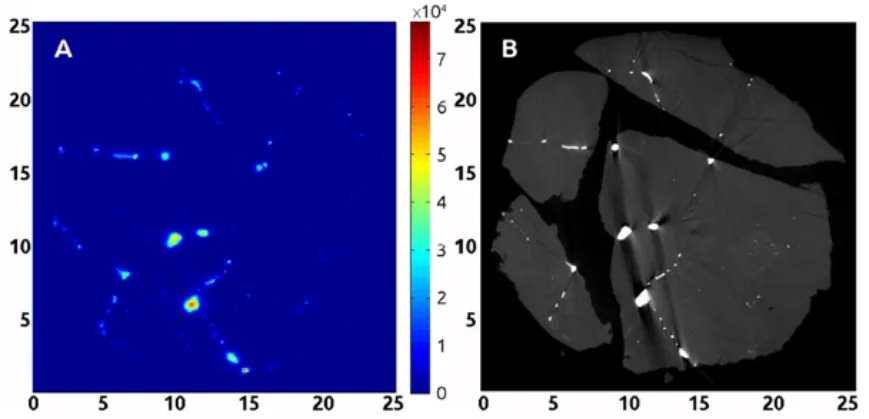
Rapid, simultaneous multi-element measurements require little to no sample preparation and remove only a small amount of material. Sensitivity to light elements such as carbon, lithium, and silicon makes LIBS useful for ore-grade evaluation and sorting in metallurgical applications.
Jewelry and Gemstone Analysis
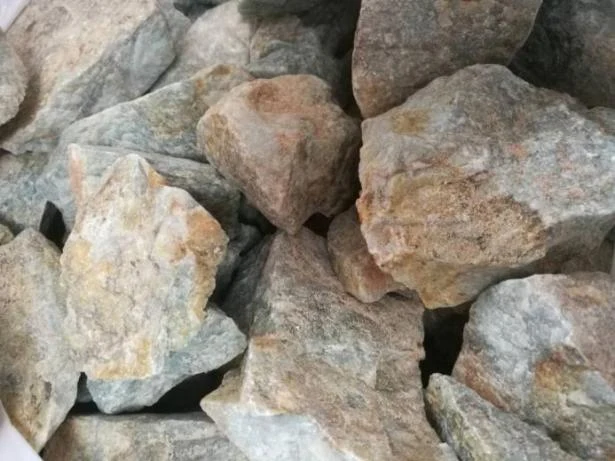
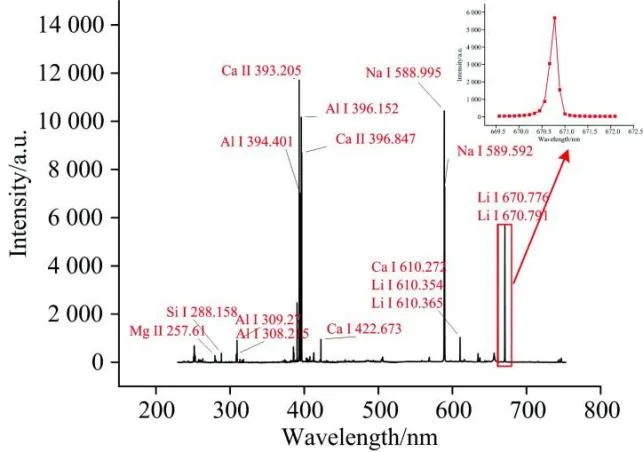
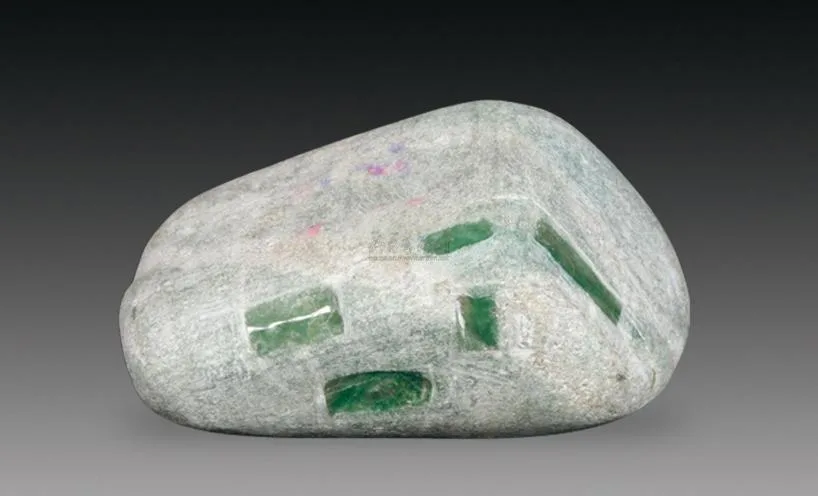
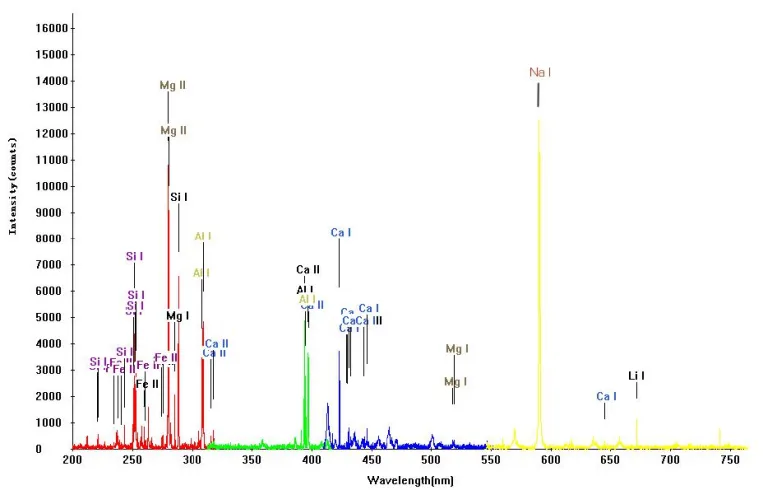
Elemental composition influences gemstone properties, classification, color, and commercial value. Iron, for example, can strongly affect jadeite color. LIBS supplies rapid elemental information to support gemstone evaluation, identification, and classification.
Coal Analysis
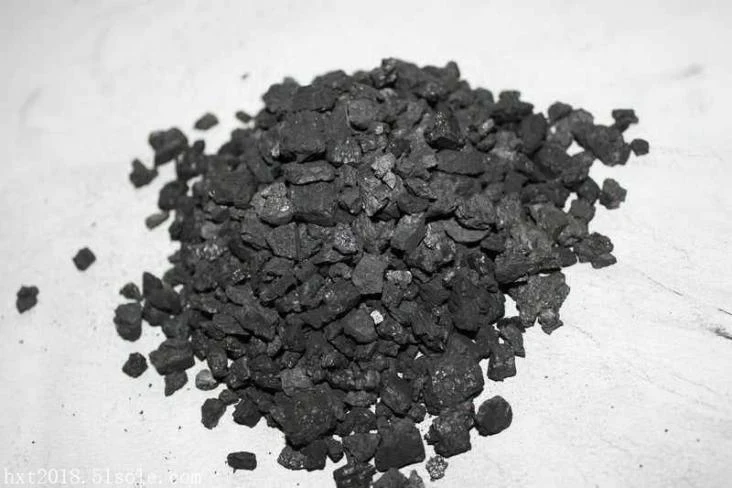
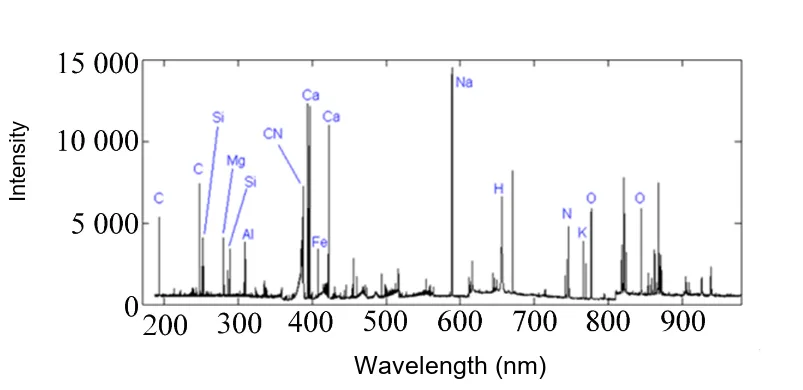
LIBS measures major elements such as C, H, O, and N, along with mineral-associated elements including Na, Fe, Al, and Ca. Elemental concentration and distribution data support coal characterization, quality evaluation, and research.
Soil Heavy-Metal Analysis
Heavy-metal contamination can reduce soil fertility and pose risks to human health. Rapid LIBS screening and quantitative elemental analysis support contamination assessment, remediation research, and pollution-control programs.

Traditional Herbal Medicine Analysis
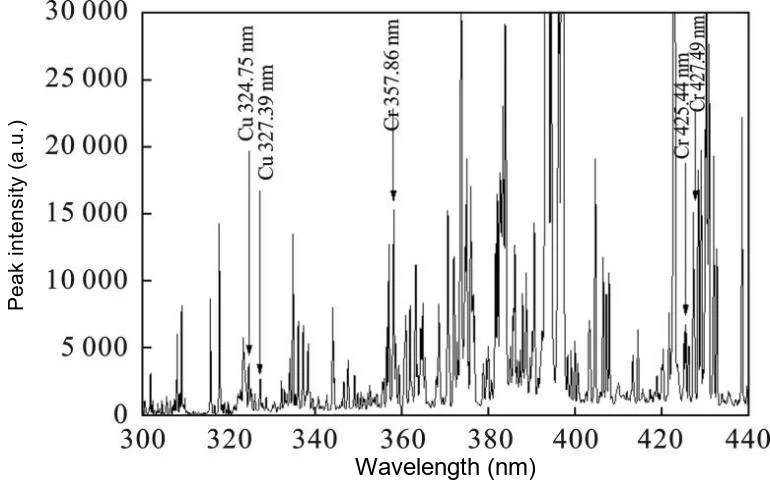
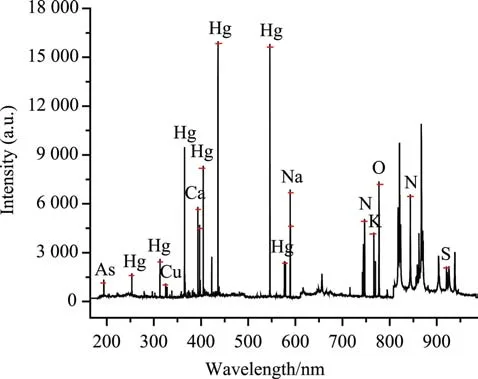
LIBS spectral-feature extraction and chemometric methods can distinguish herbal materials exposed to different levels of sulfur fumigation. Rapid, simultaneous multi-element measurements support elemental fingerprinting and research into relationships between composition, quality, and efficacy.
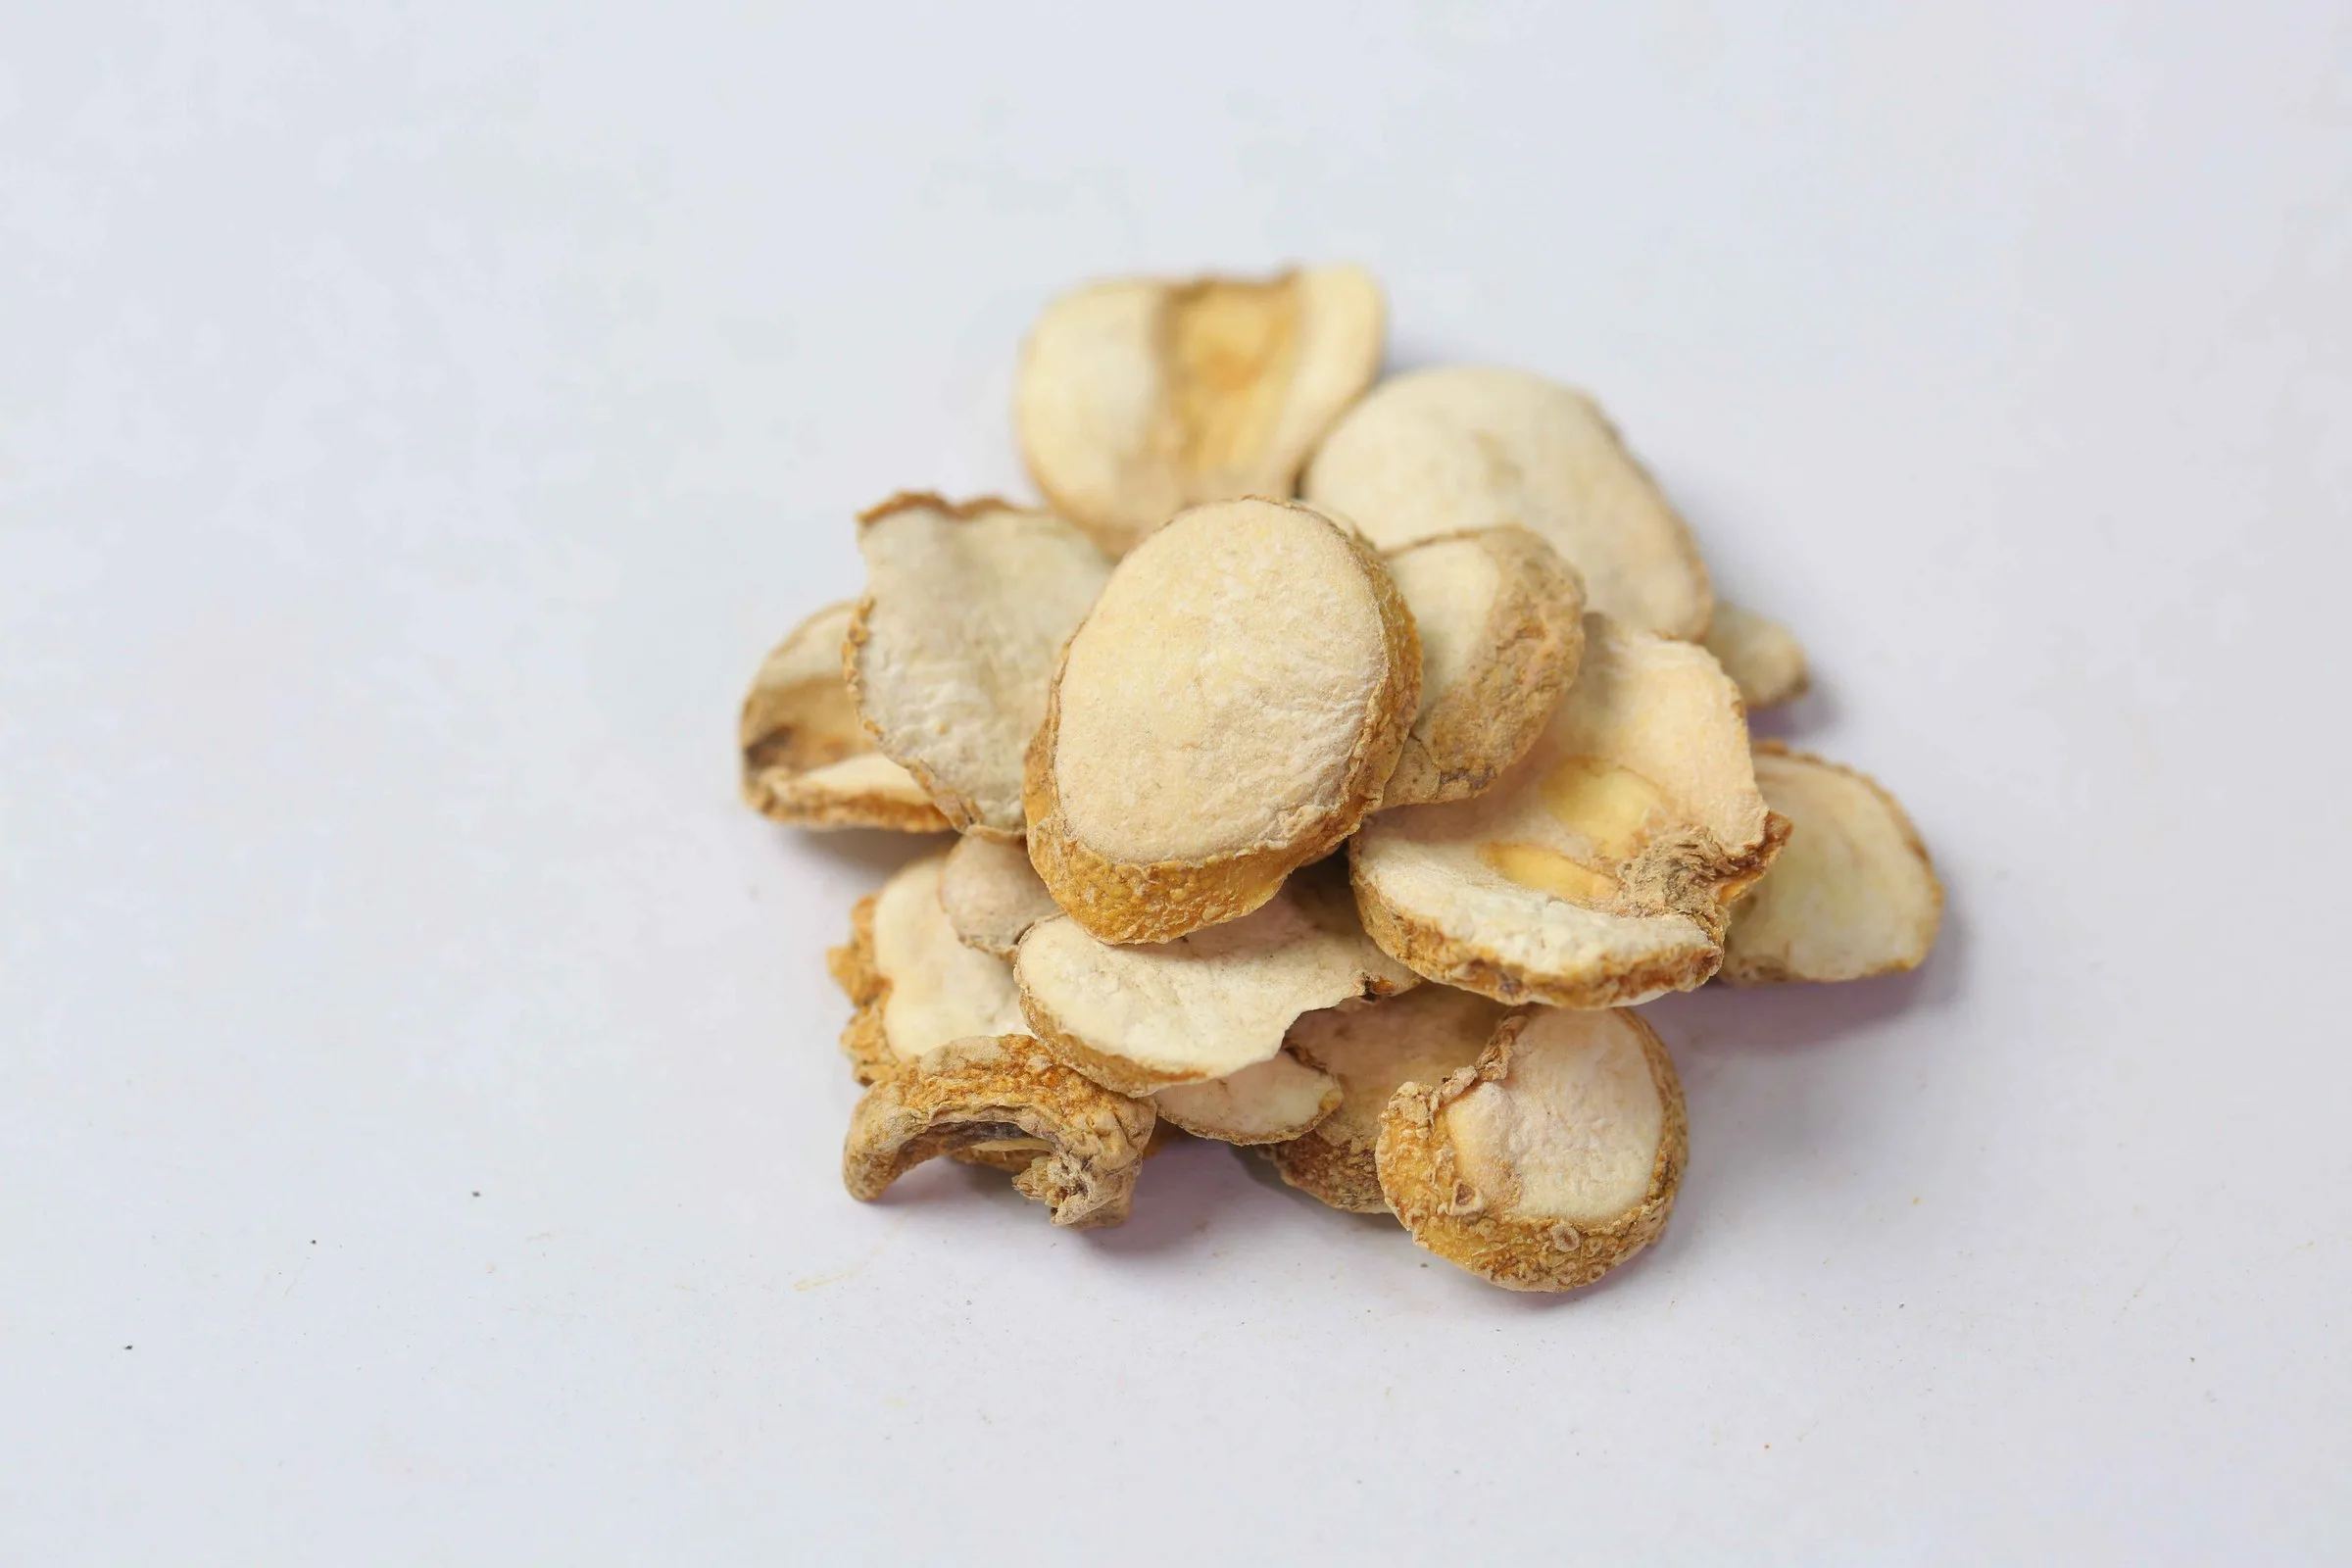
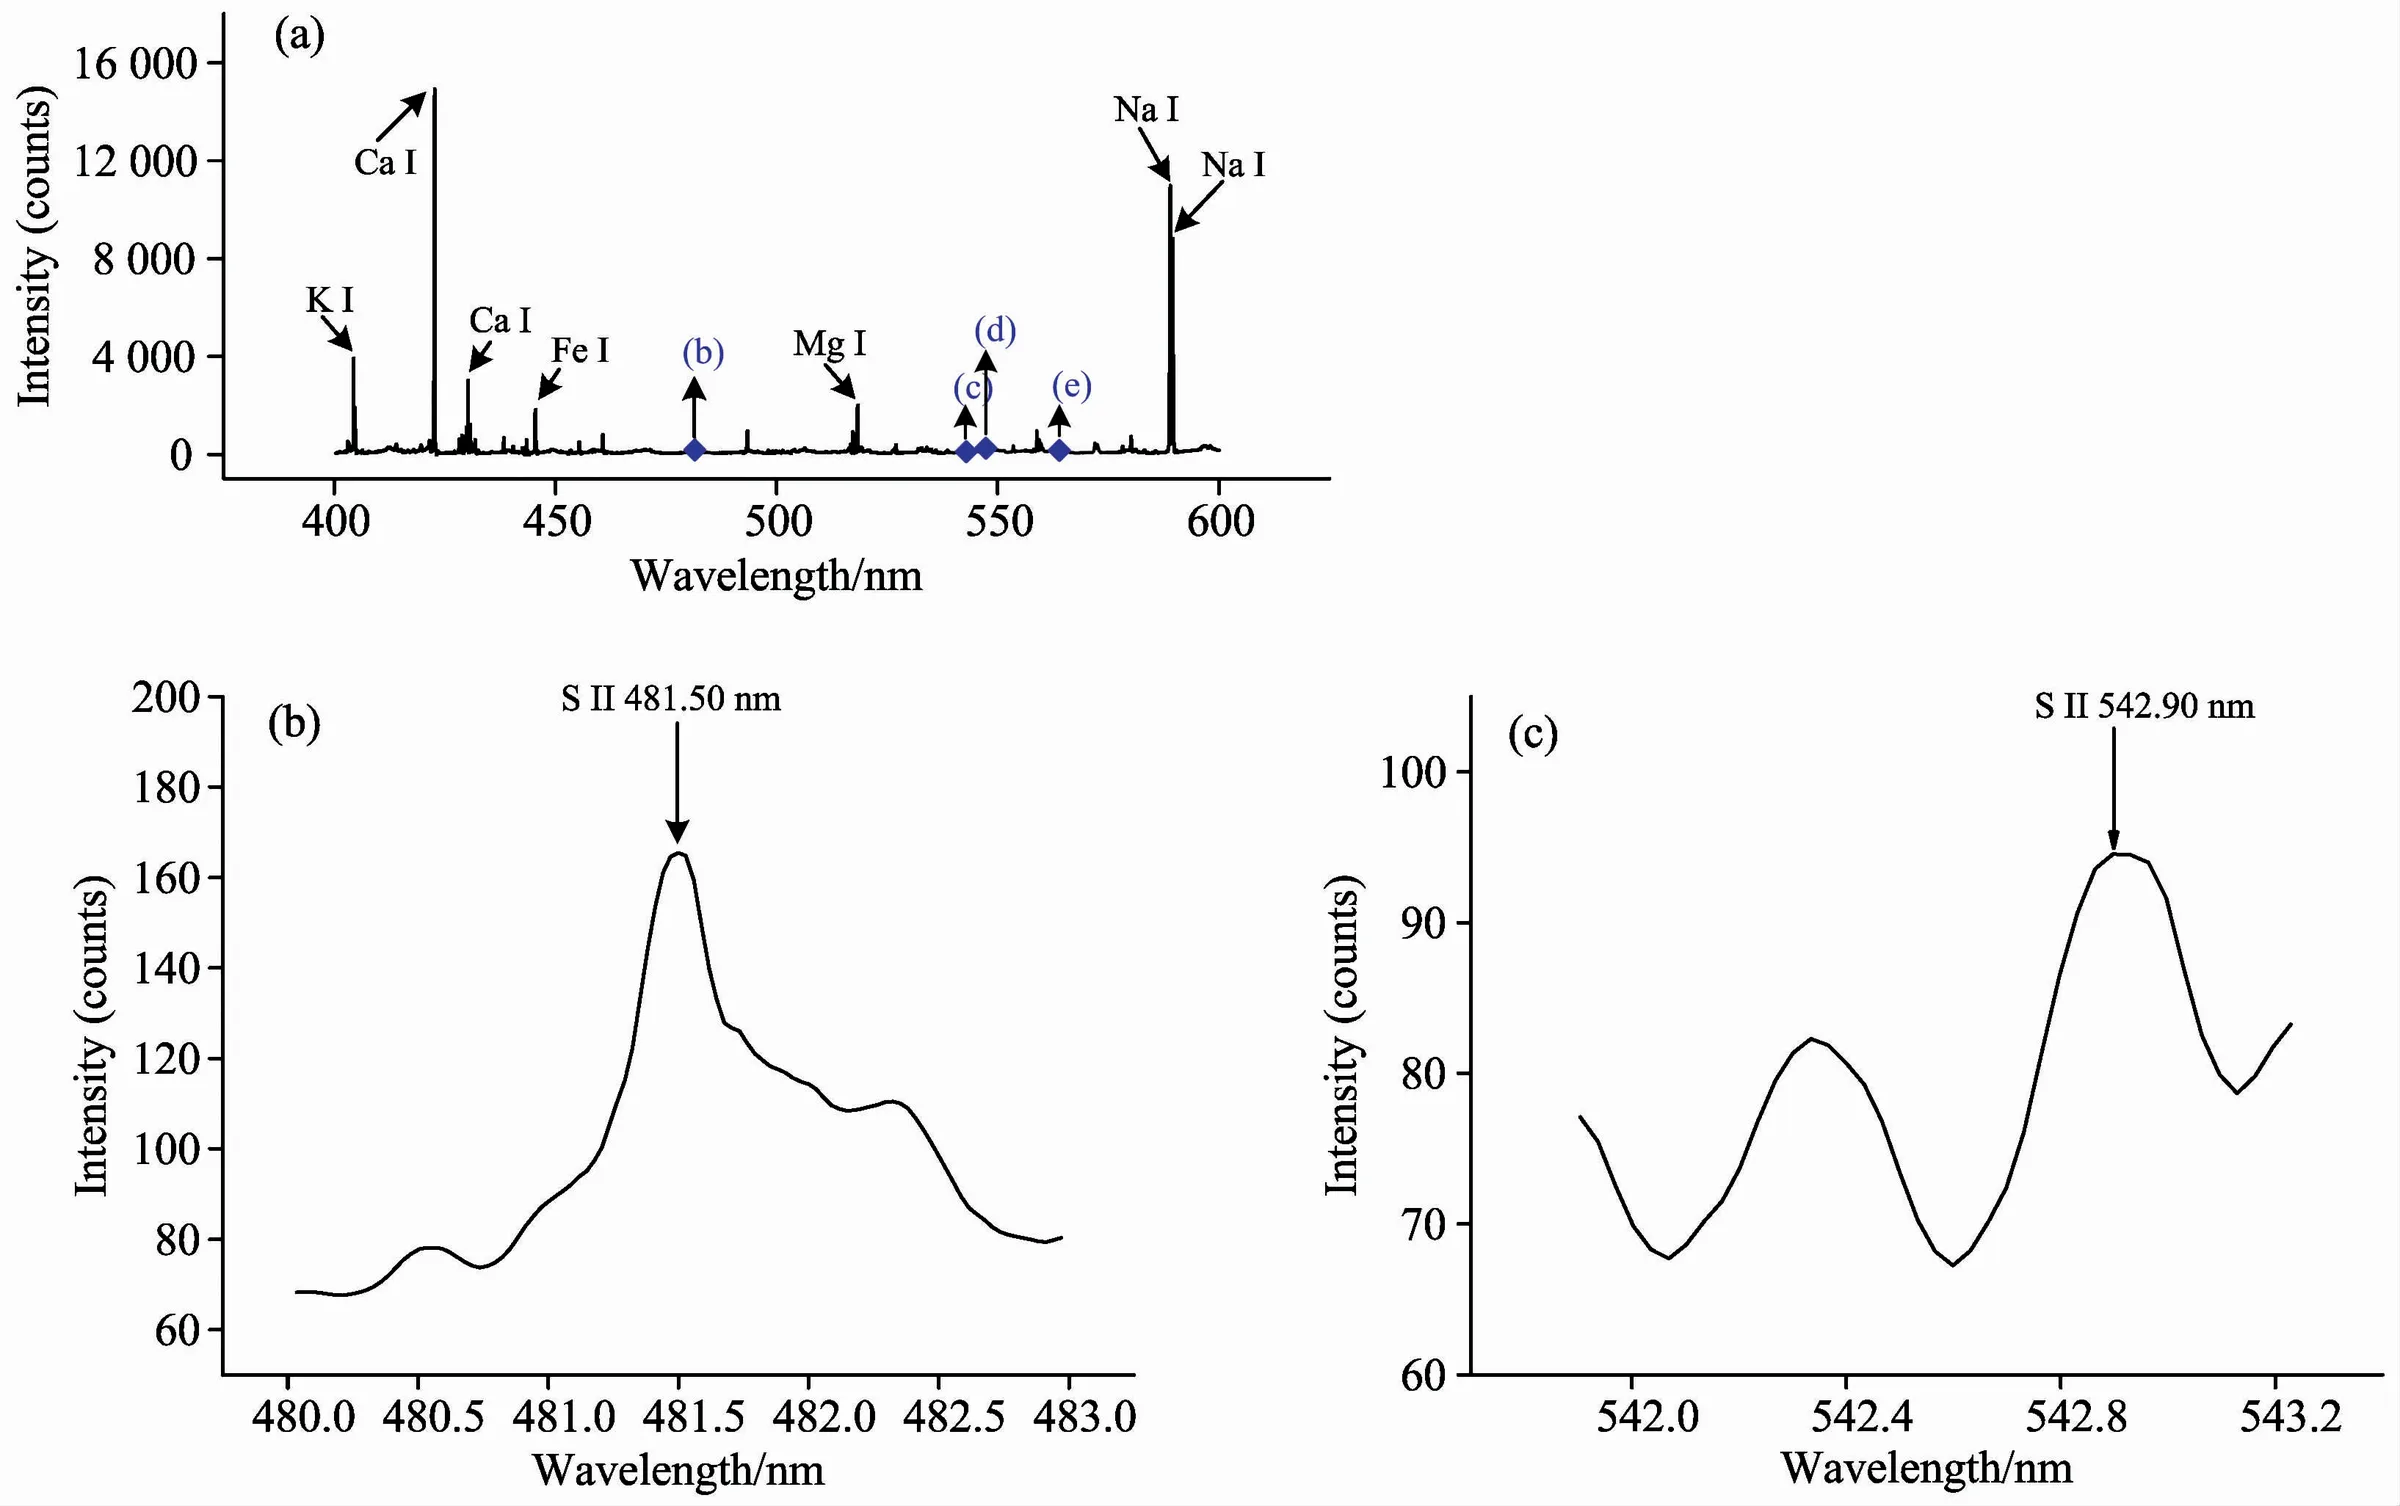
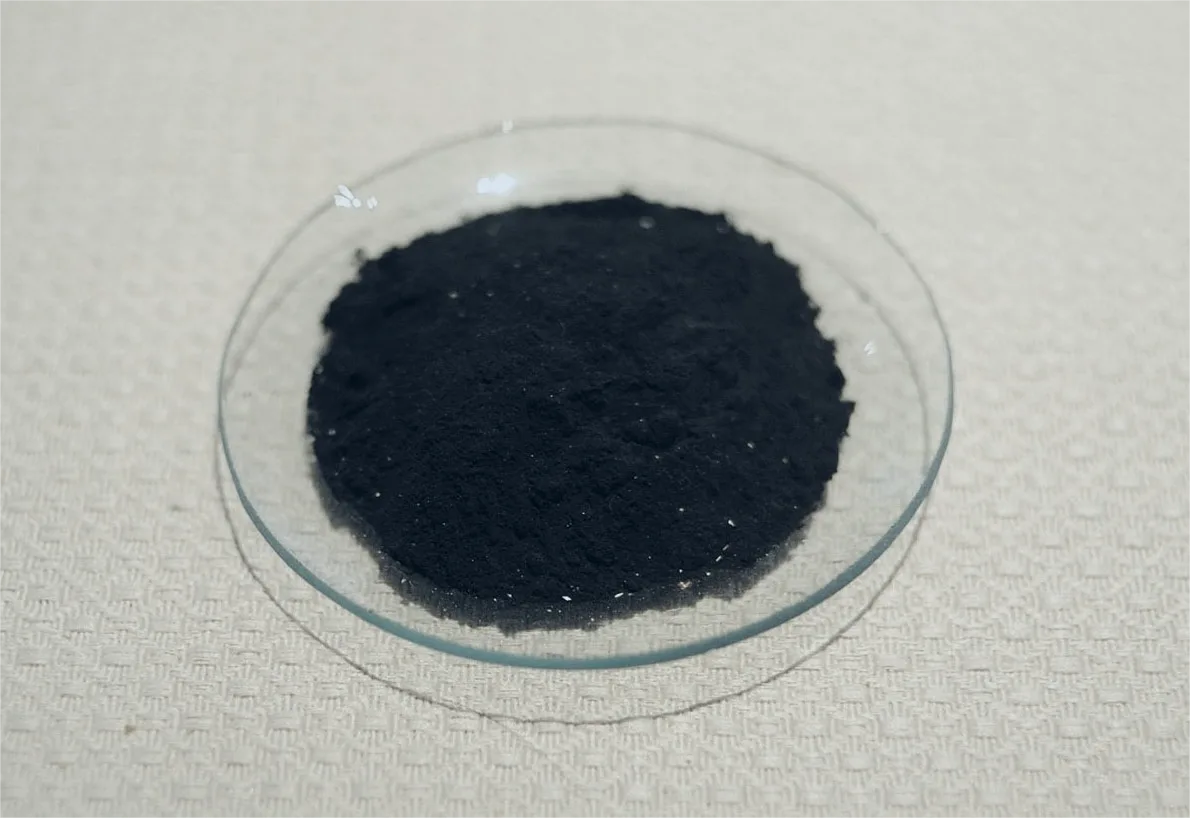
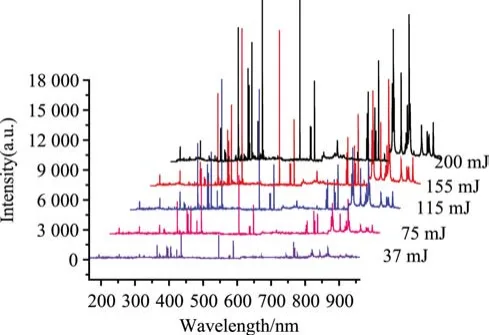
The source also presents rapid elemental analysis of Tibetan medicine “Tso Thal,” including spectra acquired at different laser pulse energies.
| Sample | Detected Elements |
|---|---|
| Blumea balsamifera | C, Ca, Mg, Na, K, N, H, O, Sr, Ba, Li, etc. |
| Huanglian, Fupian, and Fuling | Cu, Pb |
| Gastrodia | C, P, Si, Mn, Mg, Fe, Al, Ca, Ti, Cu |
| Mugwort and Agarwood | Mn, Ca, Fe, Cu |
| Stir-Fried Alisma Rhizome | C, Mg, Al, Si, P, Ca, Ti, Mn, Fe, etc. |
| Zuotai | Ca, Na, K, Ag, Fe, Au, S, Pb, Zn, Hg, As, etc. |
| Danshen | Ca, Mg |
| Tibetan Medicine | Ca, Na, K, Mg, Ag, Cu, Hg, Li, Ba, Sr, Fe, etc. |
| Honey | Ca, Mg, Na |
| Coptis Rhizome | Pb |
| Jujube | Ca, Fe, Na |
| Capsule | Cr |
| Rush Pith | C, Mg, Ca, Al, Na, K, Ba, Li, N, H, etc. |
| Gelatin | Cr |
| Fritillaria thunbergii Bulb | K, Ca, Fe, Mg, etc. |
| Kelp | Cr |
Cement Quality Analysis
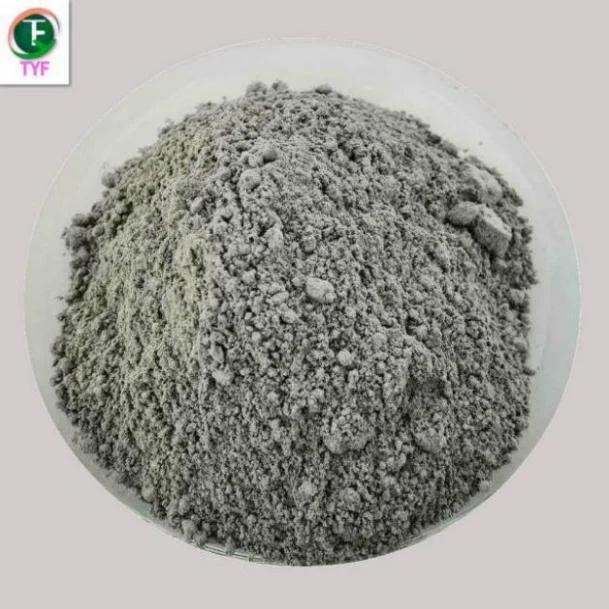
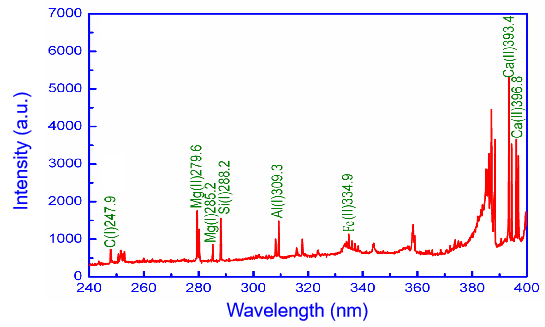
Real-time measurement of Ca, Si, Al, Fe, and Mg in cement raw meal supports key process-ratio calculations and raw-material blending control. LIBS helps maintain kiln-feed consistency and finished-product quality while reducing energy consumption and emissions.
Power Industry Insulator Contamination Analysis
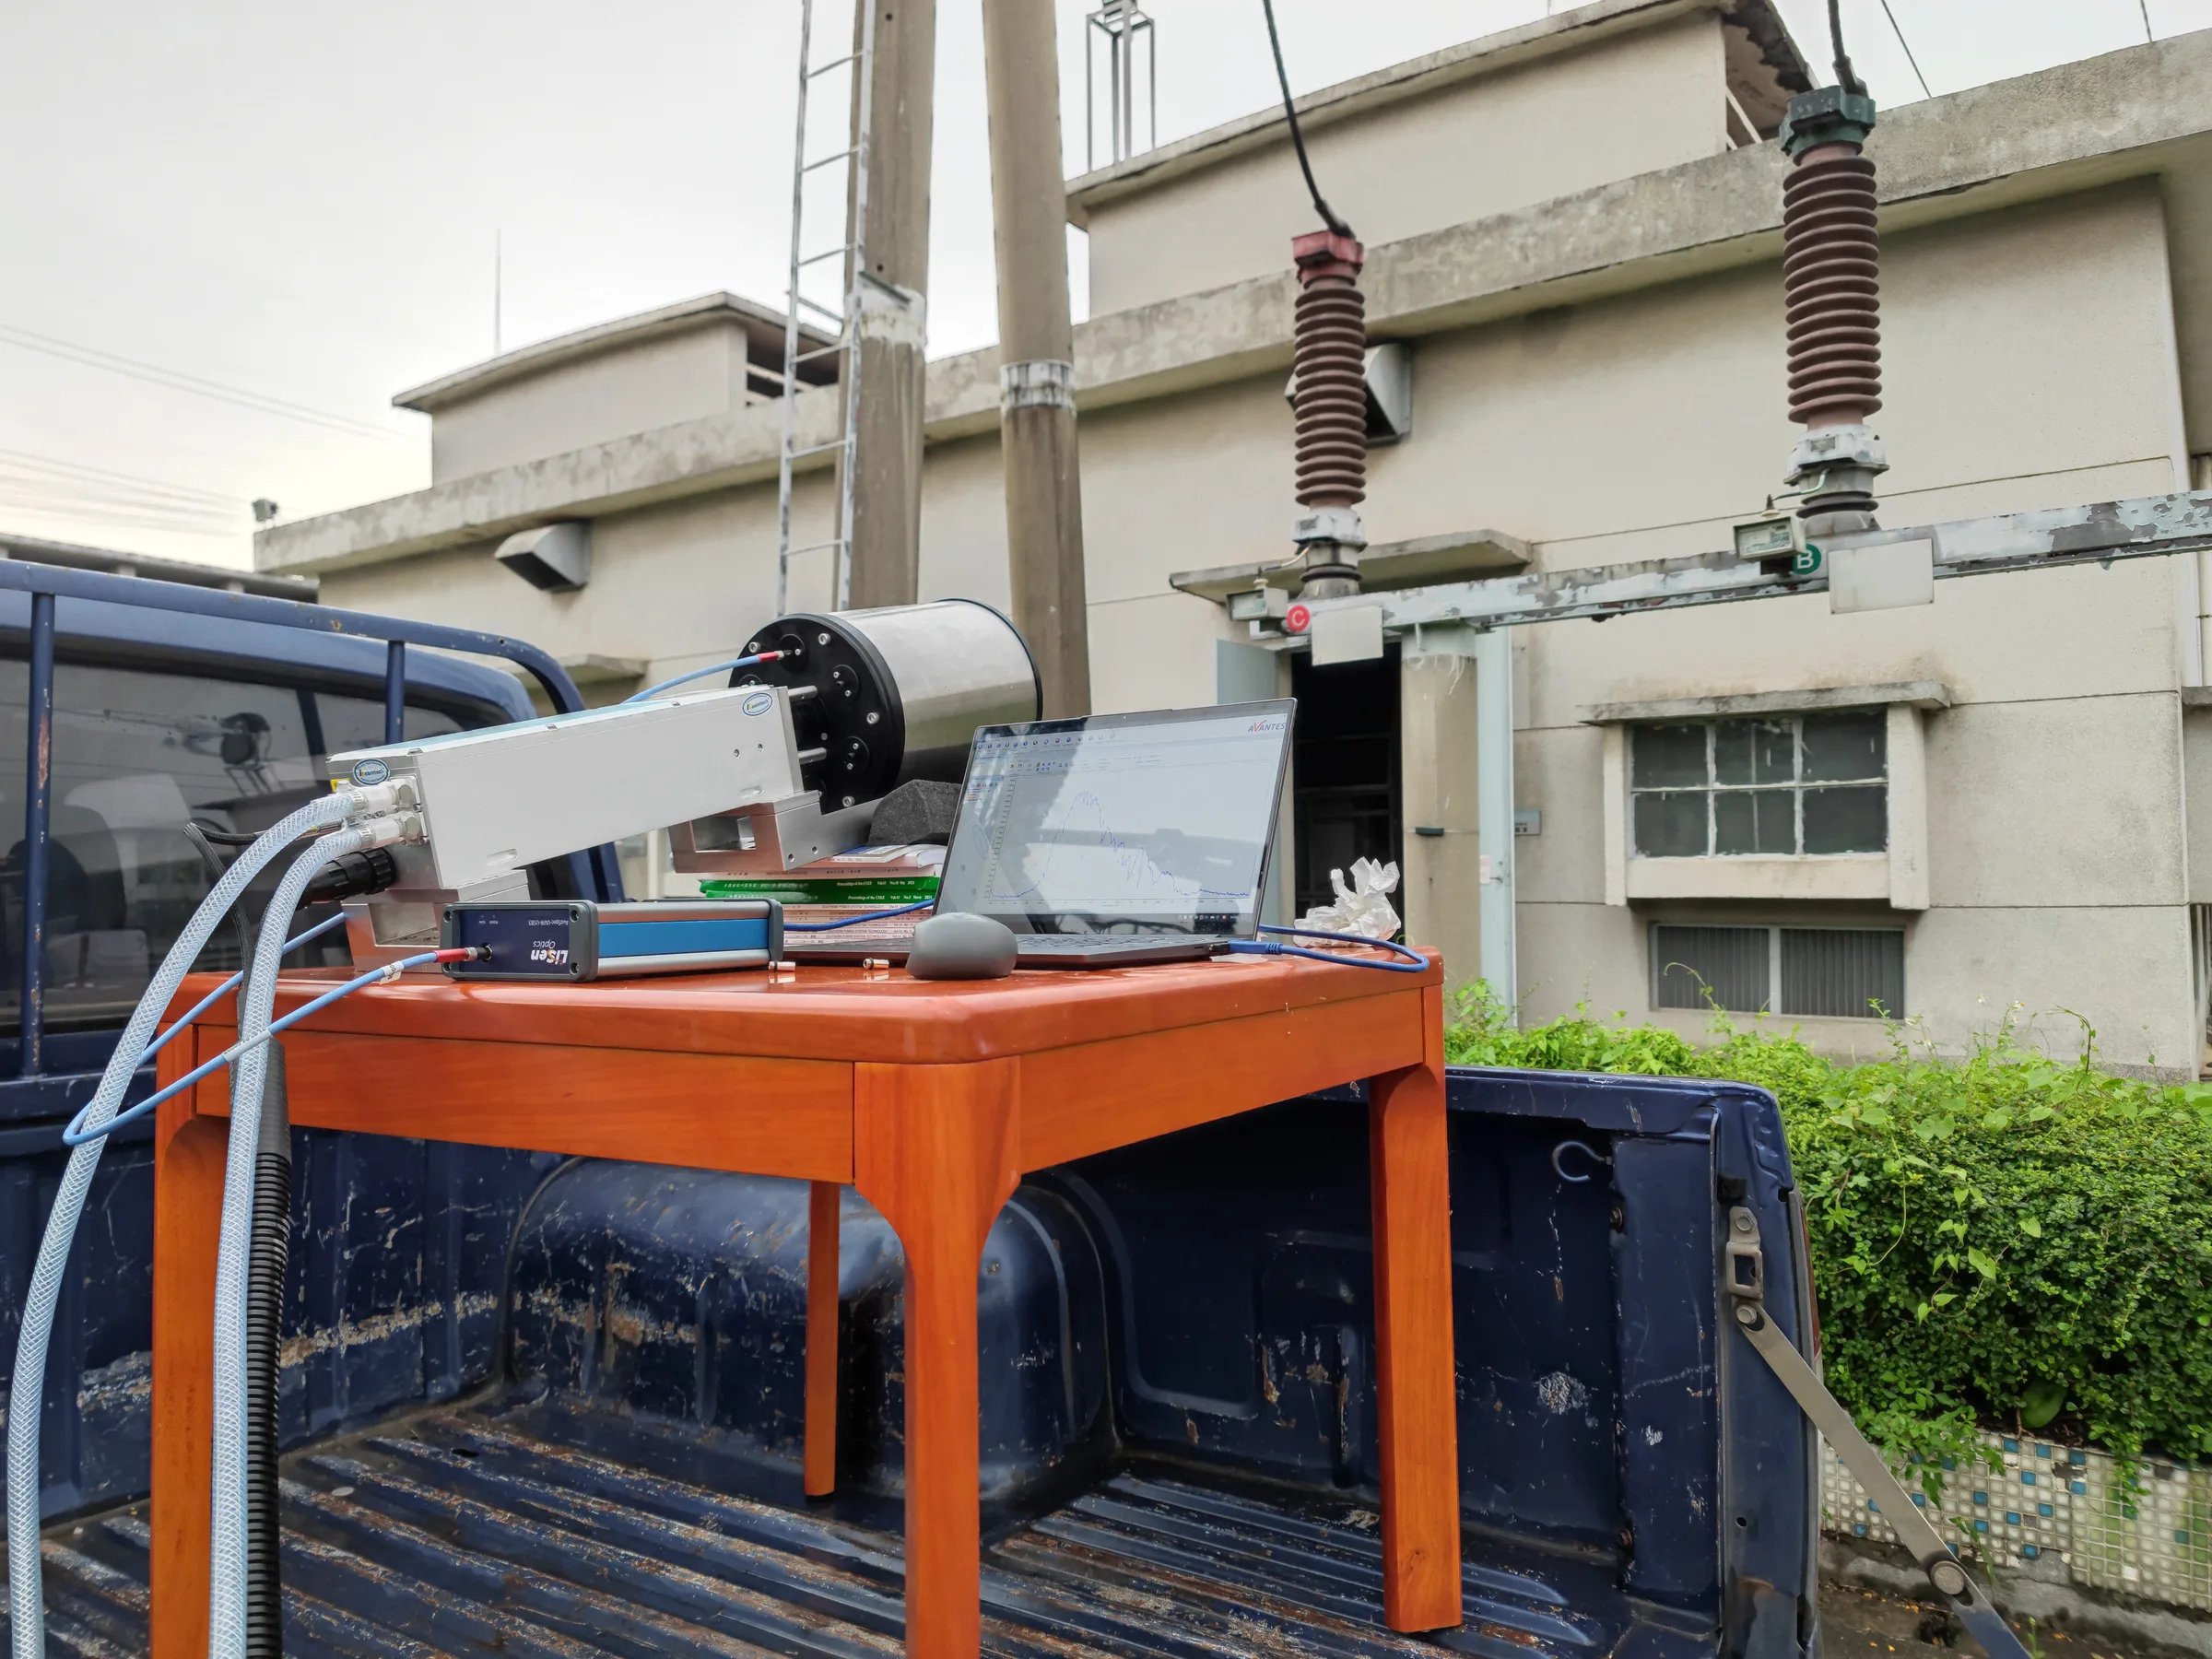
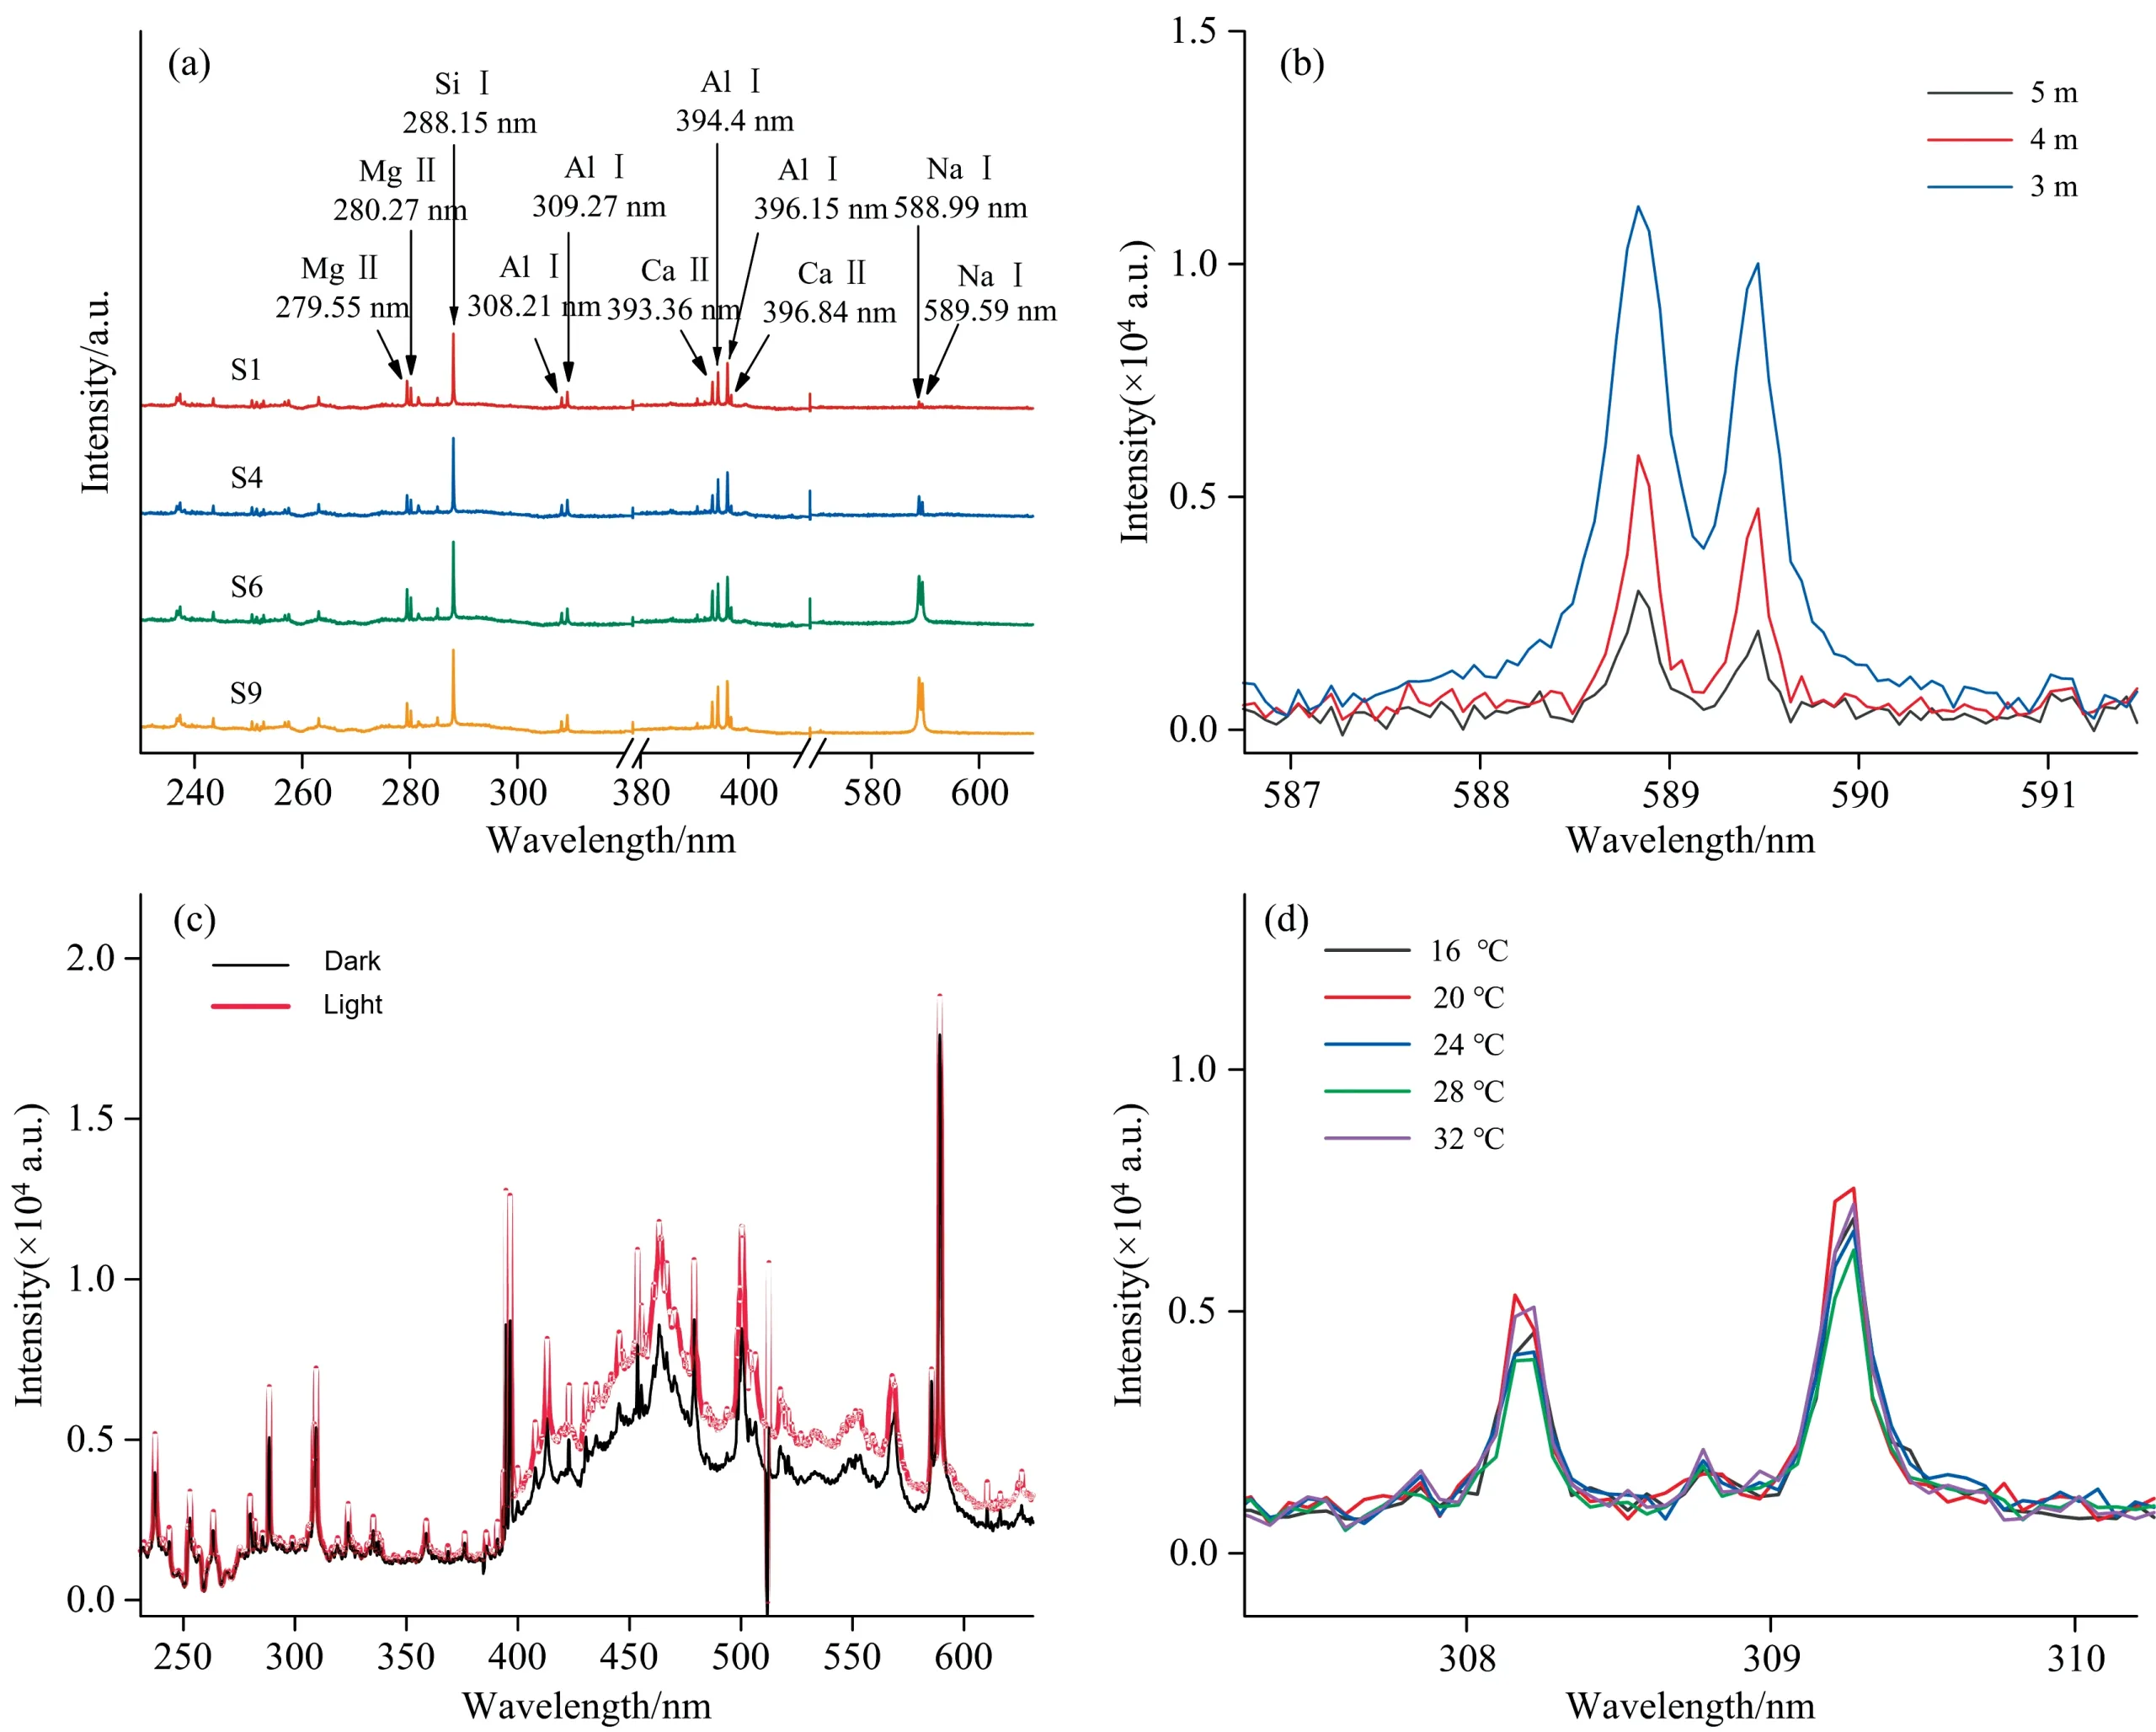
Rapid in-situ LIBS measurements support field applications in the power industry. Combined with machine-learning algorithms, the spectra can classify different levels of insulator contamination for condition assessment and maintenance.
In-Line Petroleum Coke Analysis
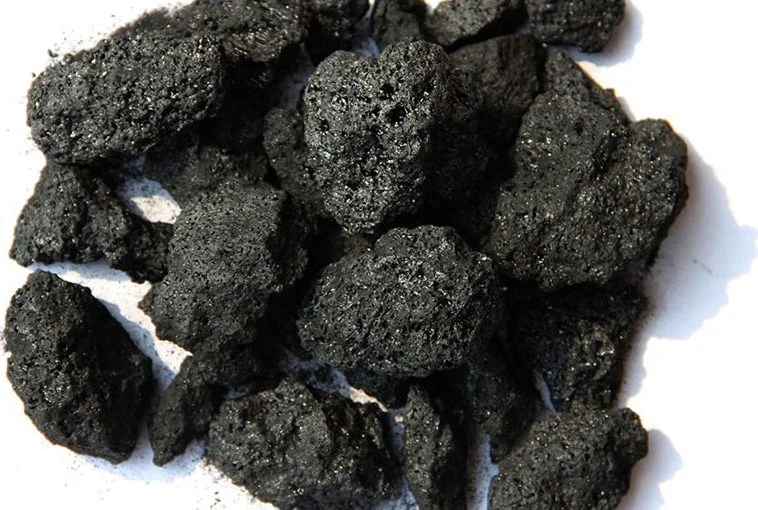
Petroleum coke is used in aluminum-smelting anodes, metallurgical fuels, graphite electrodes, and lithium-ion battery anode materials. Rapid in-line LIBS measurement of impurities such as Fe and Cu supports quality control, material grading, and reliable downstream performance.
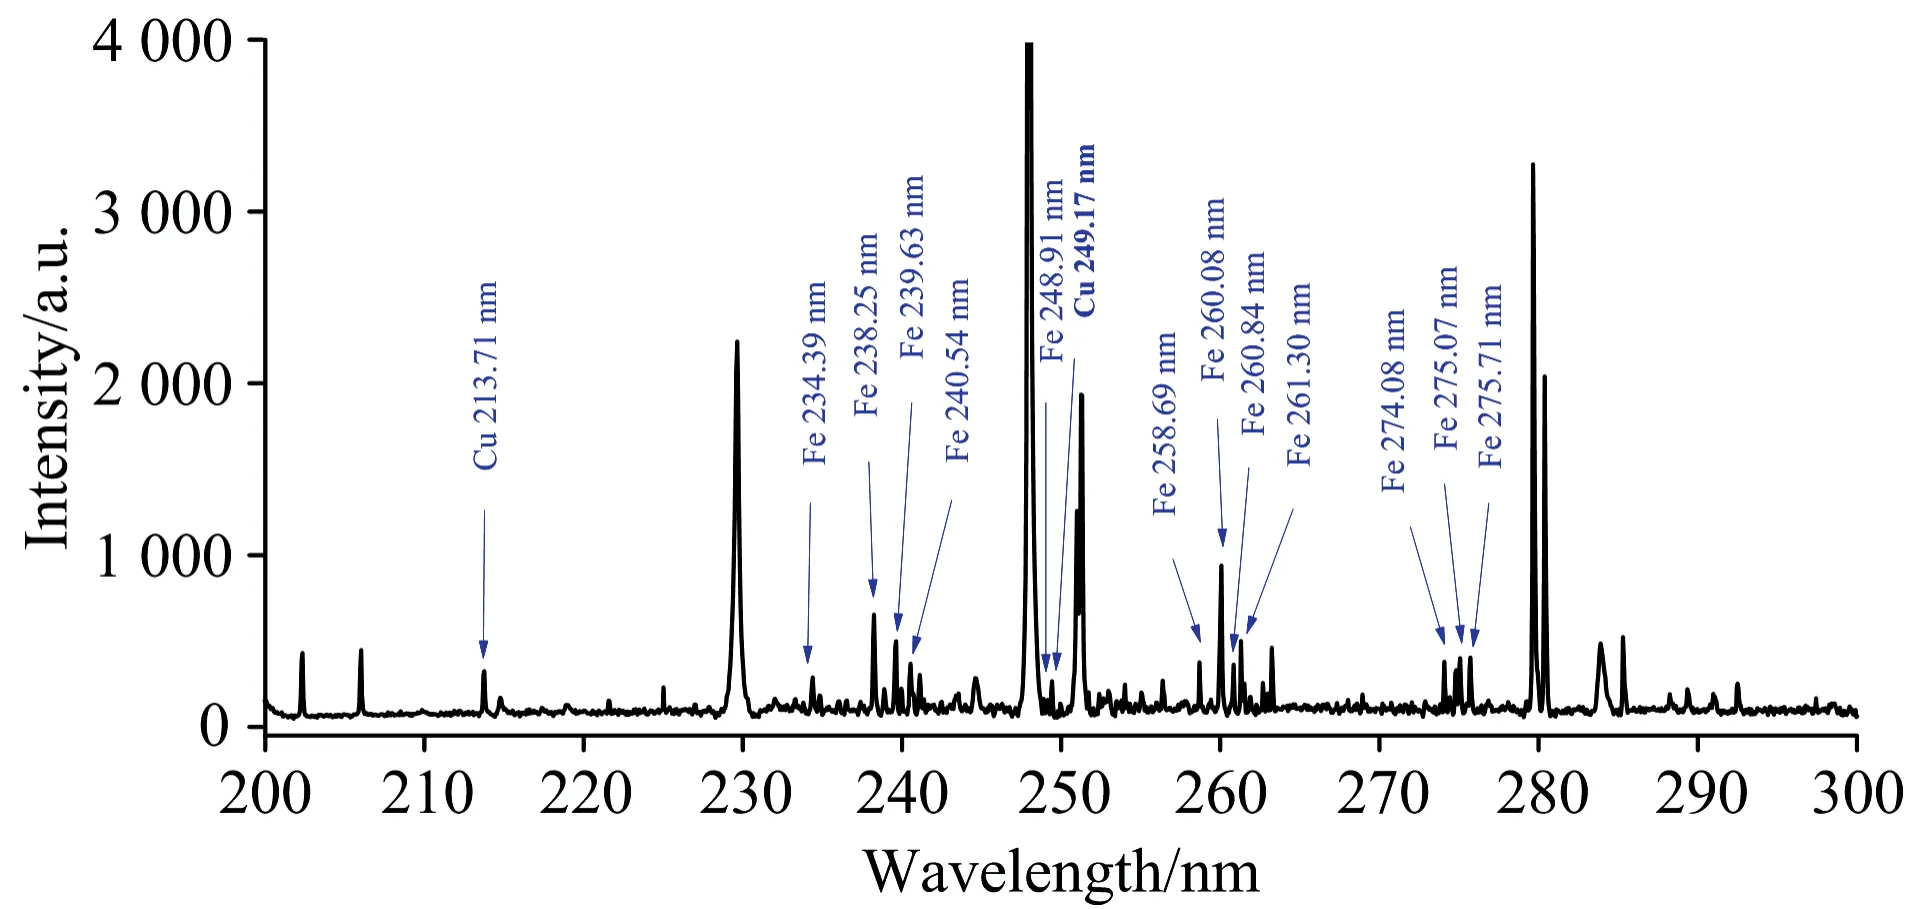
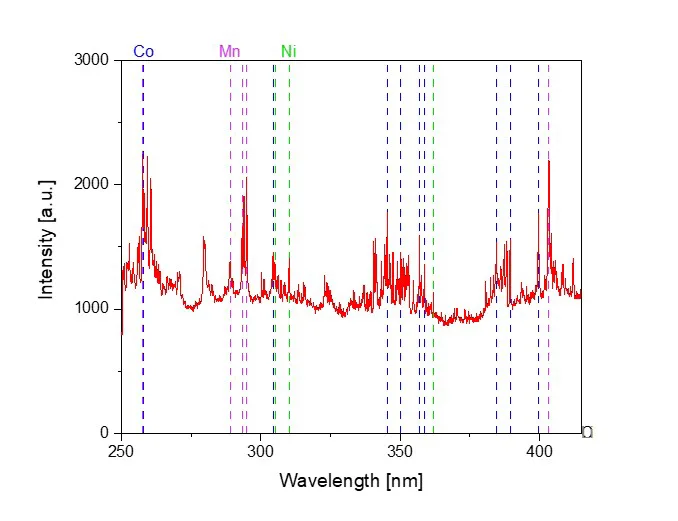
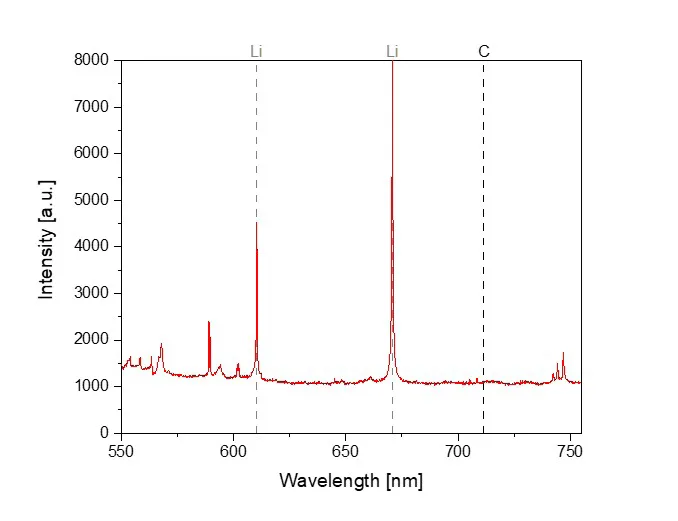
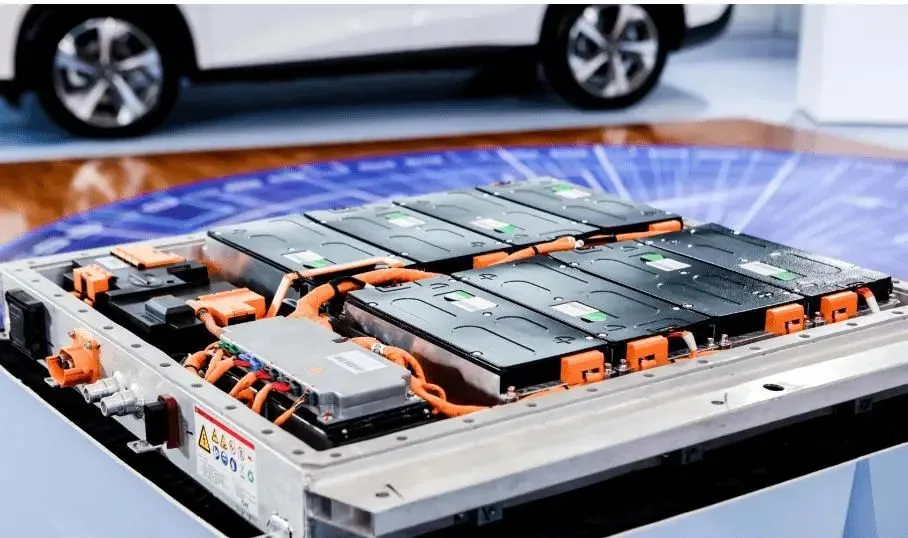
Lithium-Ion Battery Materials
Accurate elemental analysis of electrode materials is important for improving battery performance. LIBS provides rapid quantitative data with minimal sample preparation and offers potential for future in-situ battery-material measurements.