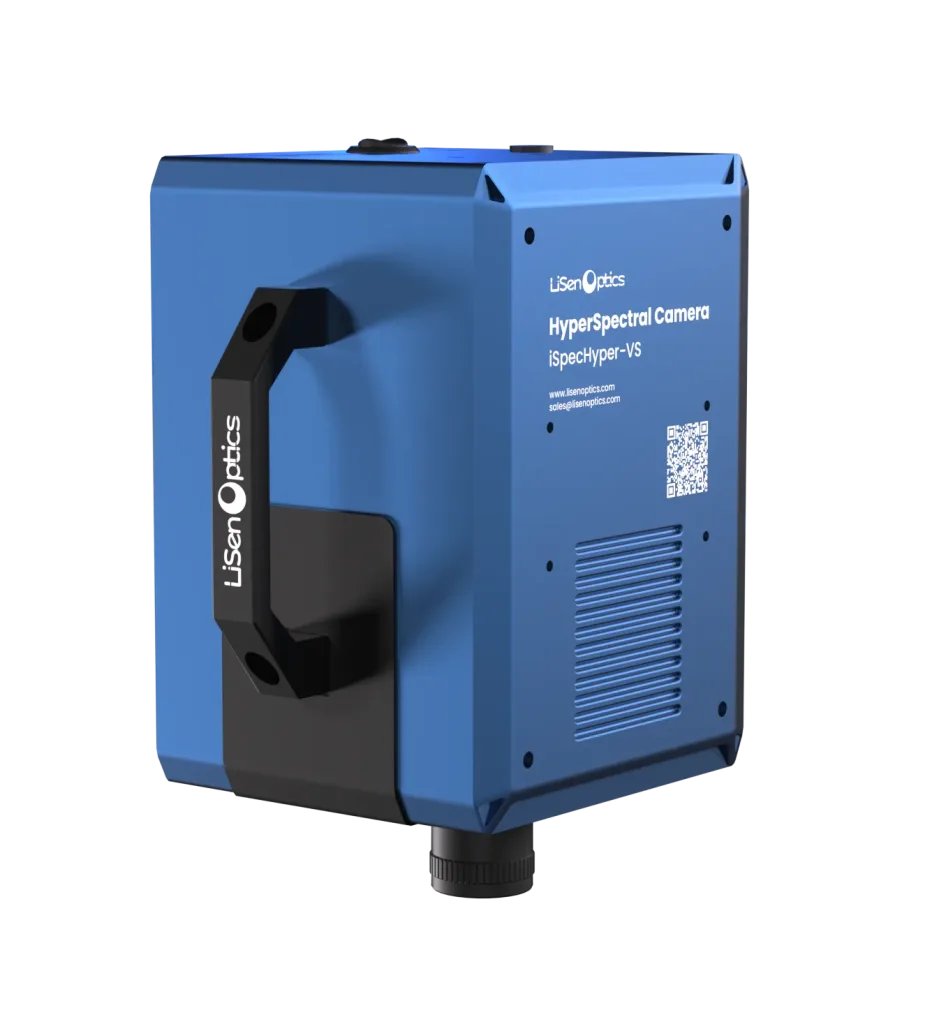
Compact Hyperspectral Imaging from 400 to 1000 nm
The LiSen Optics iSpecHyper-VS300 portable hyperspectral imaging system combines high-throughput optics, a large-format CMOS detector, and an on-chip gradient filter to capture high-quality images with high sensitivity and signal-to-noise performance.
Integrated internal push-broom scanning, USB 3.0 data transfer, and acquisition and analysis software support an efficient imaging workflow. A standard C-mount accepts interchangeable lenses for forensic analysis, precision agriculture and forestry, remote sensing, industrial inspection, biomedical research, and mineral exploration.
Key Features
- Visible and near-infrared coverage. Measure across 400–1000 nm with spectral resolution of ≤10 nm.
- High optical throughput. Chip-coated gradient spectral filtering provides high sensitivity and signal-to-noise performance.
- Interchangeable lenses. Fixed-focus manual lenses are available in 8, 16, 25, and 35 mm focal lengths.
- Live monitoring and focusing. An auxiliary camera helps monitor the scene and adjust focus.
- Image quality across the field. The optical design maintains a spot diameter of <0.5 pixel across the full field.
- Flexible analysis. ENVI-compatible data and selection of multiple regions of interest (ROIs) support spectral analysis workflows.
Product Images and System Configurations
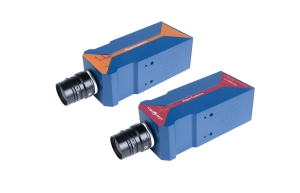
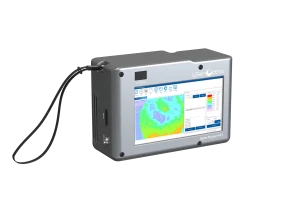
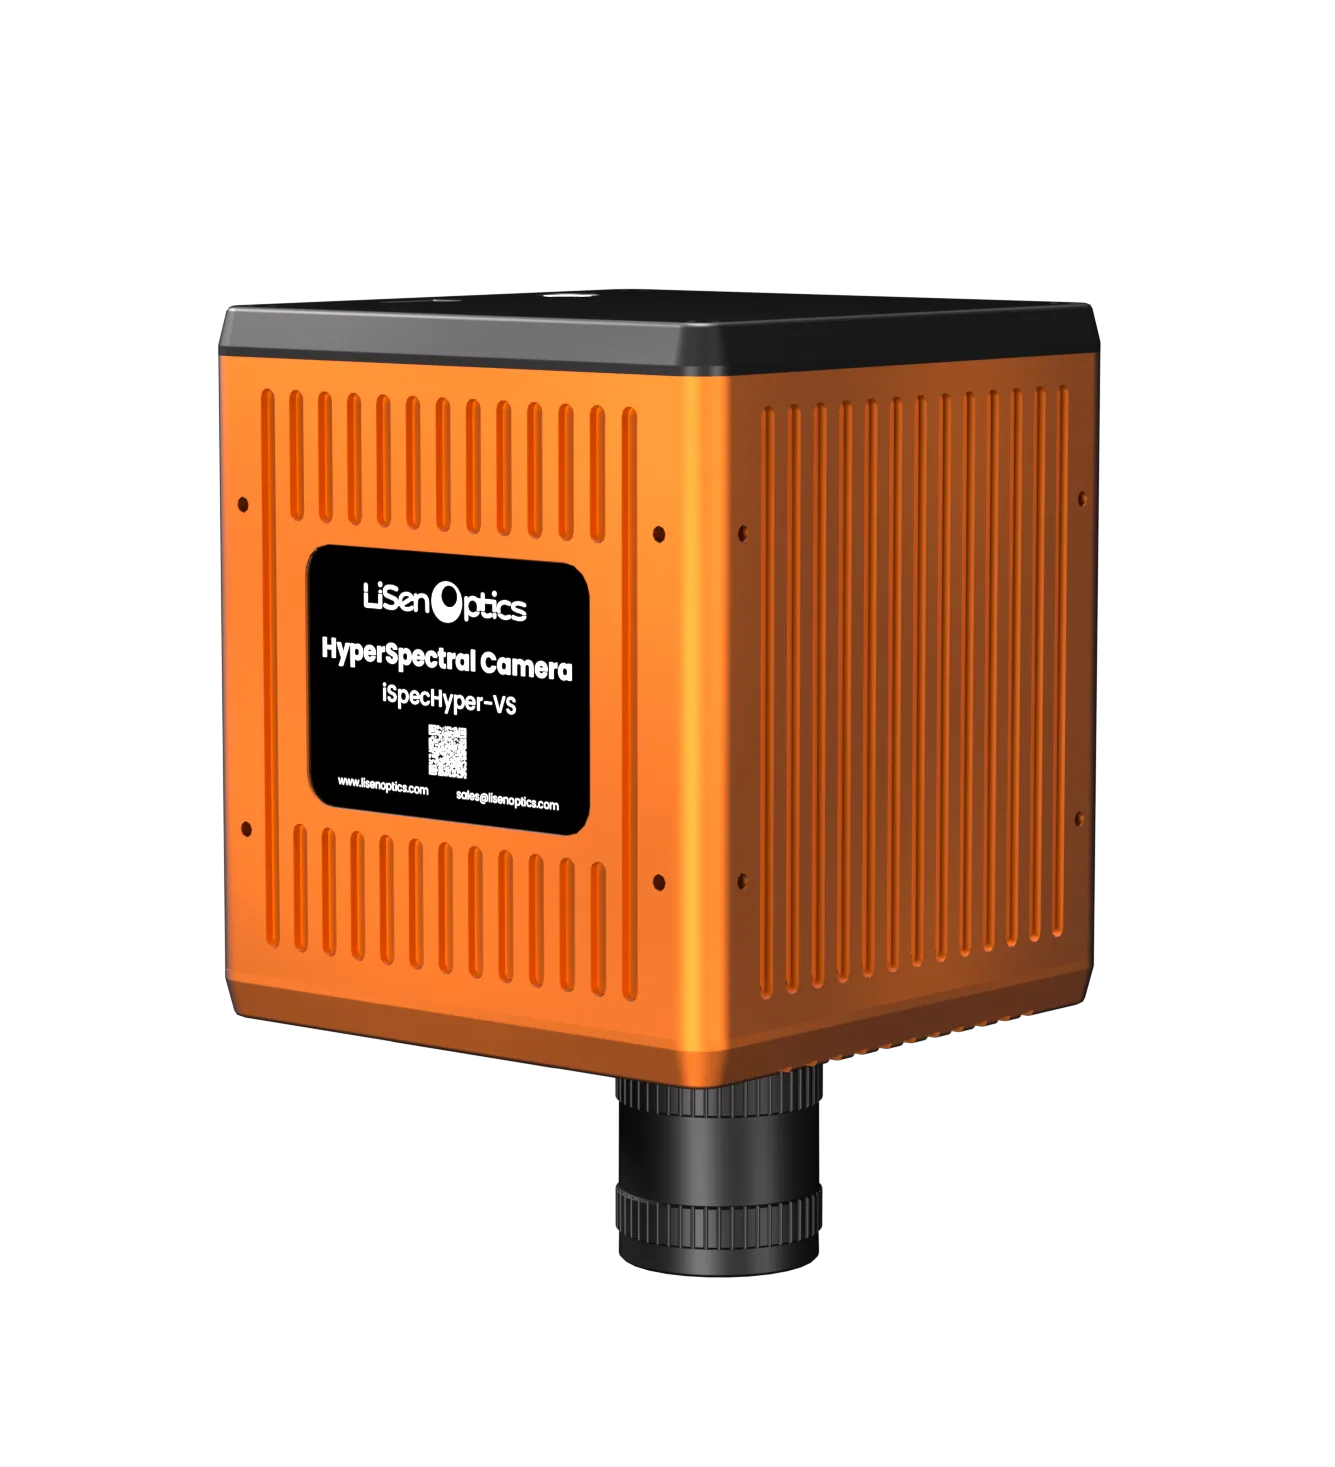
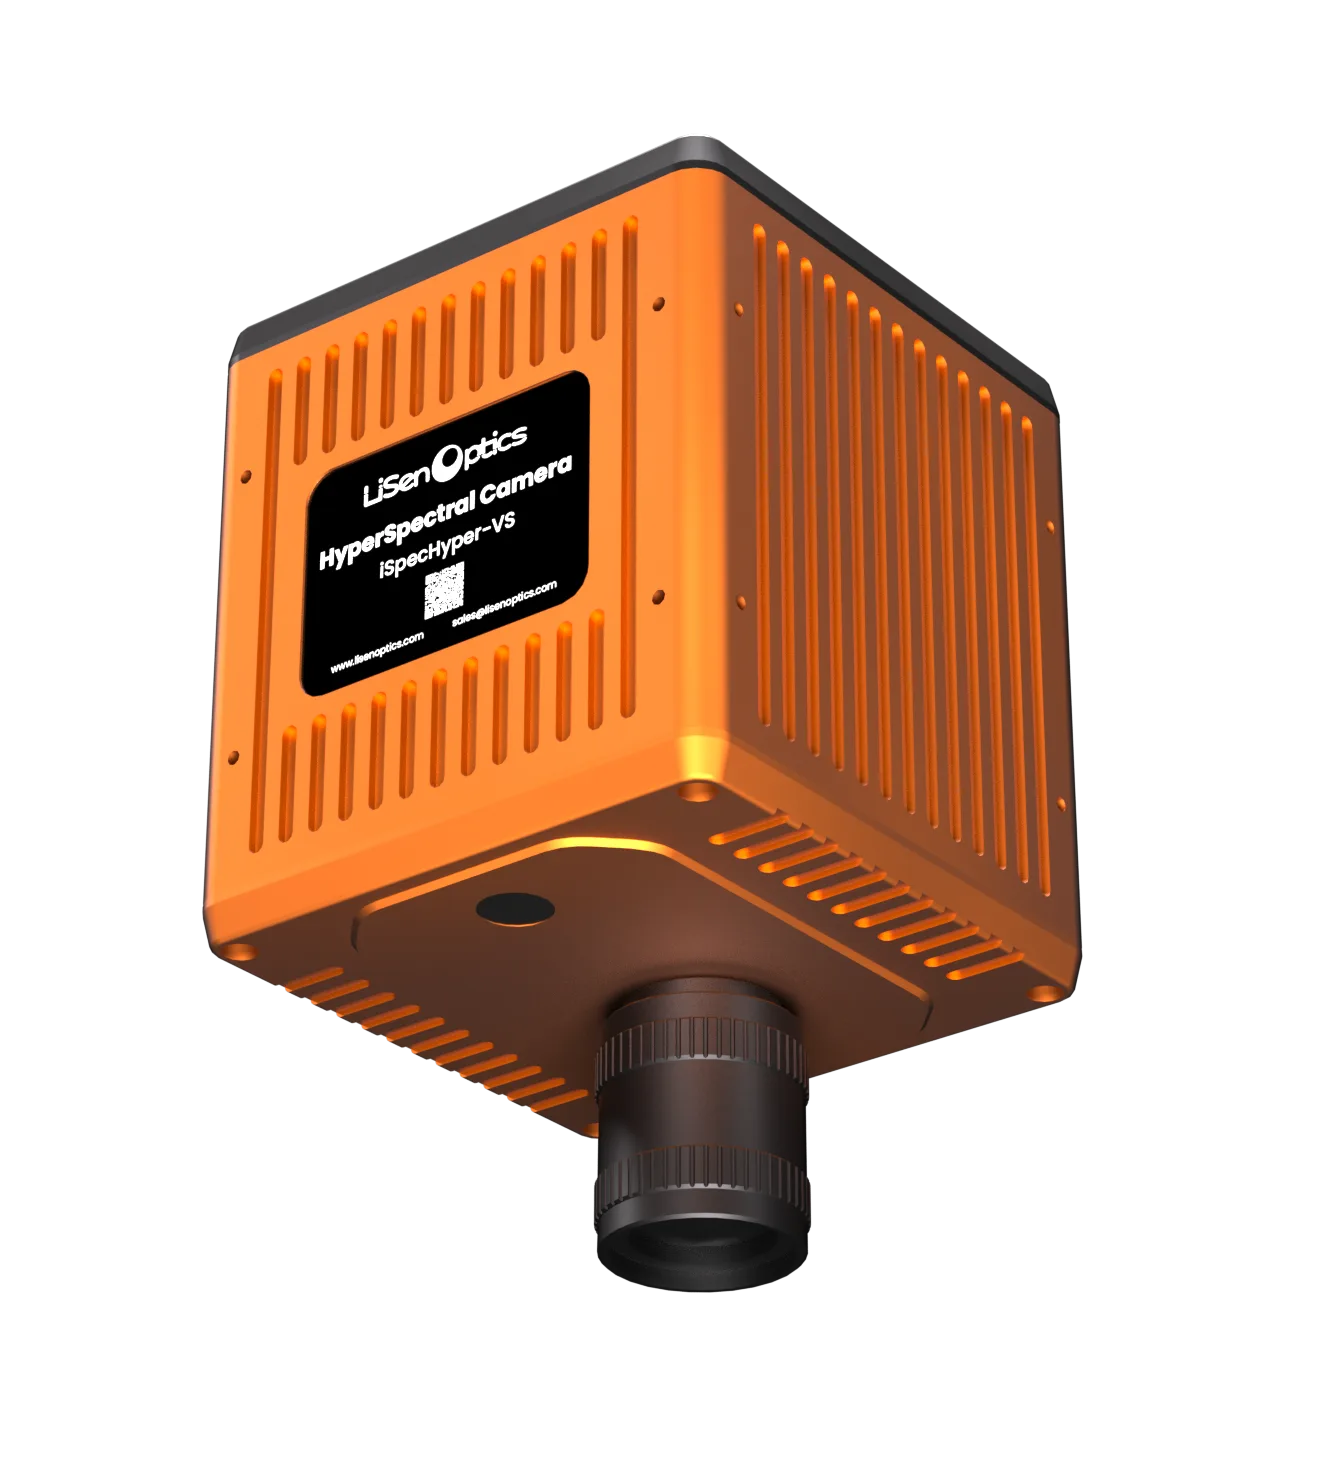
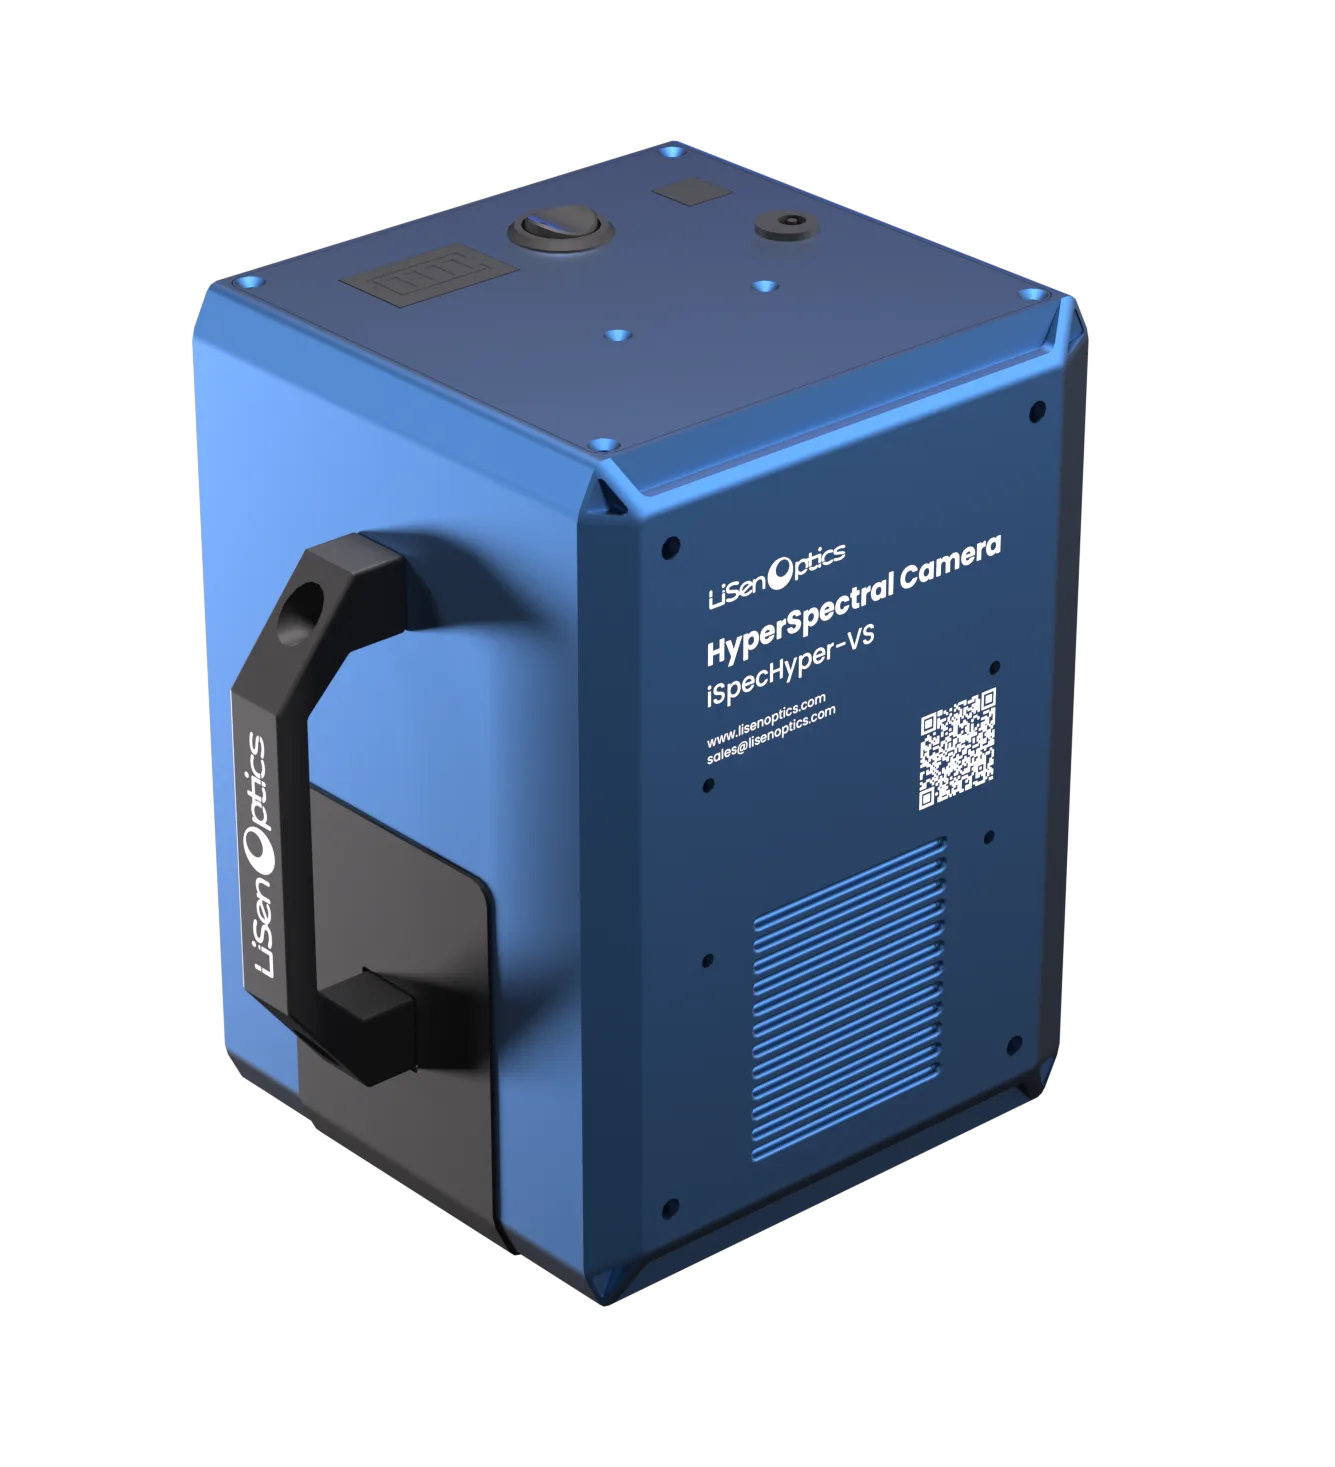
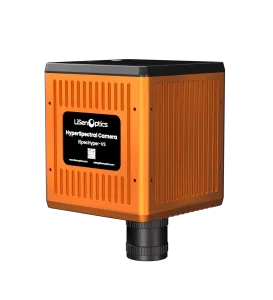
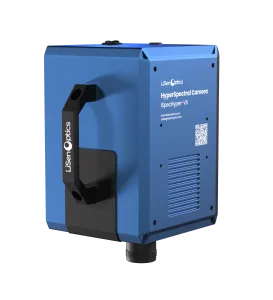
The portable iSpecHyper-VS300 and compact iSpecHyper-VS300-IND share the spectral specifications listed below. The portable model supports external power or a built-in lithium-ion battery with 2–3 hours of runtime; the IND model uses an external power supply.
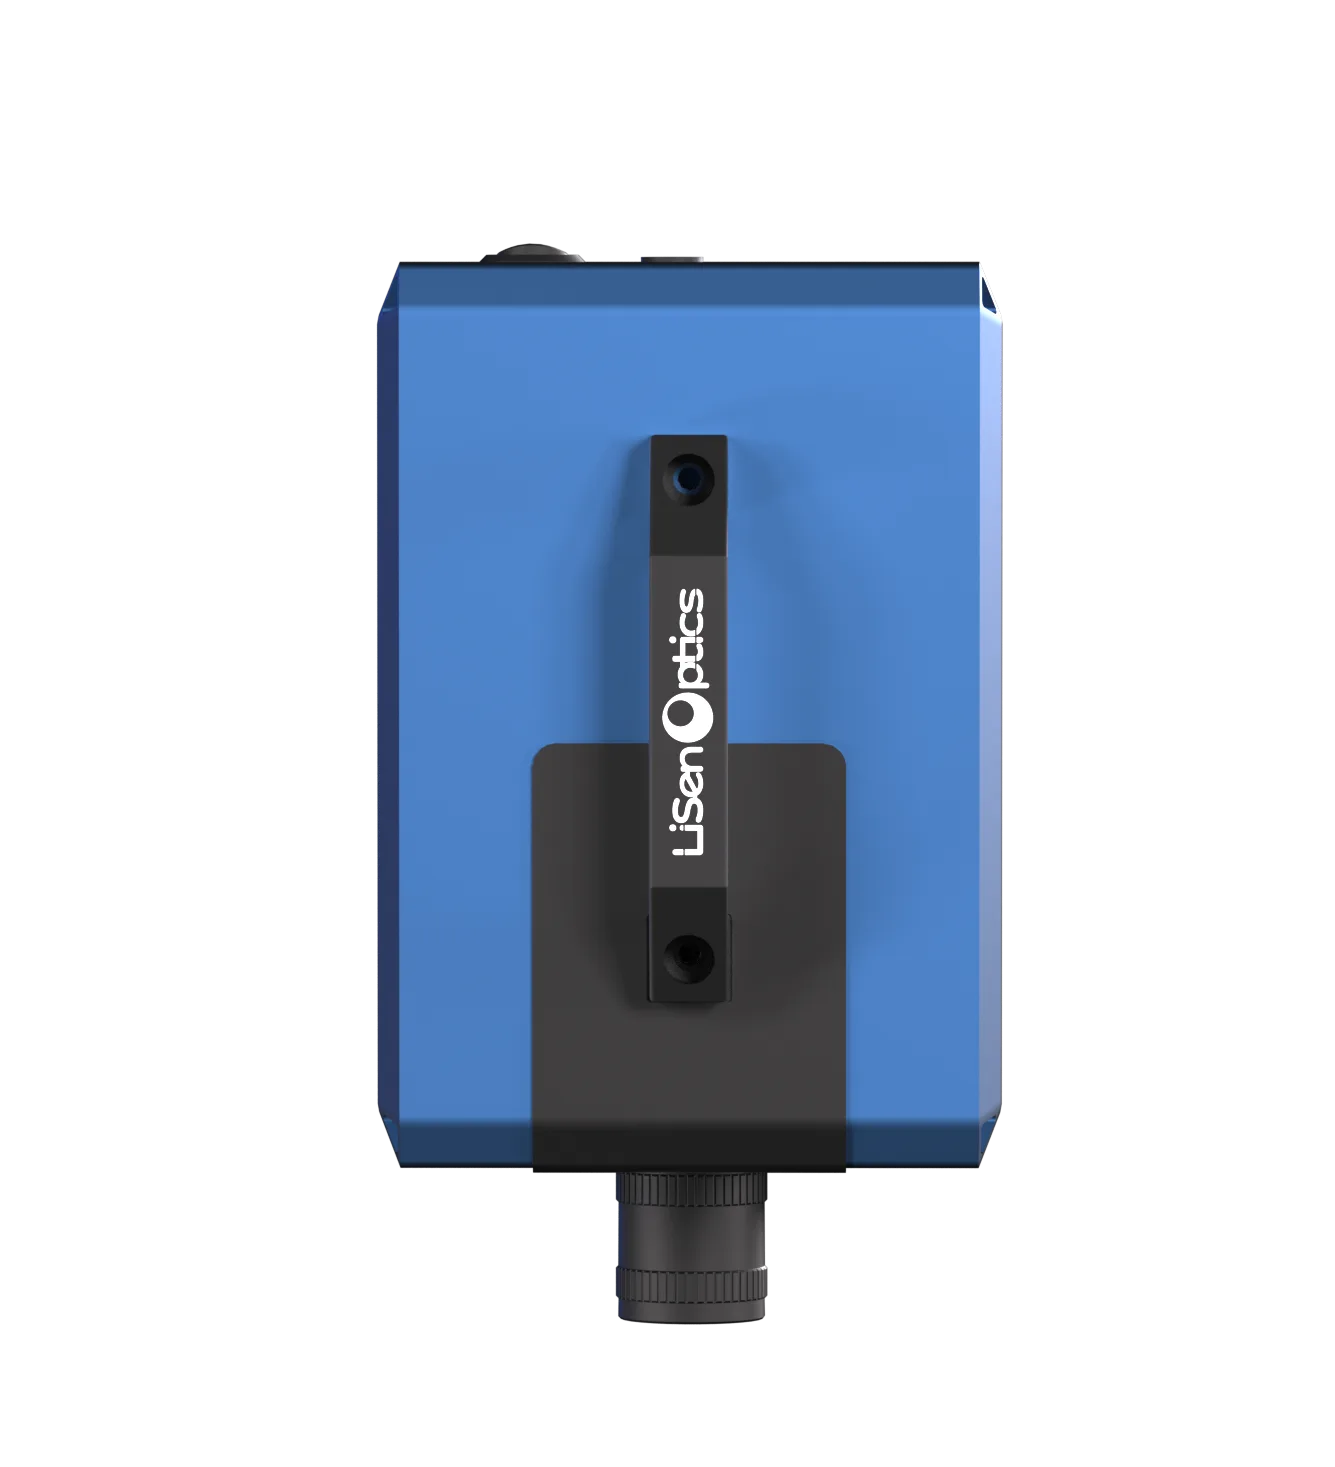
Imaging Stand and Illumination
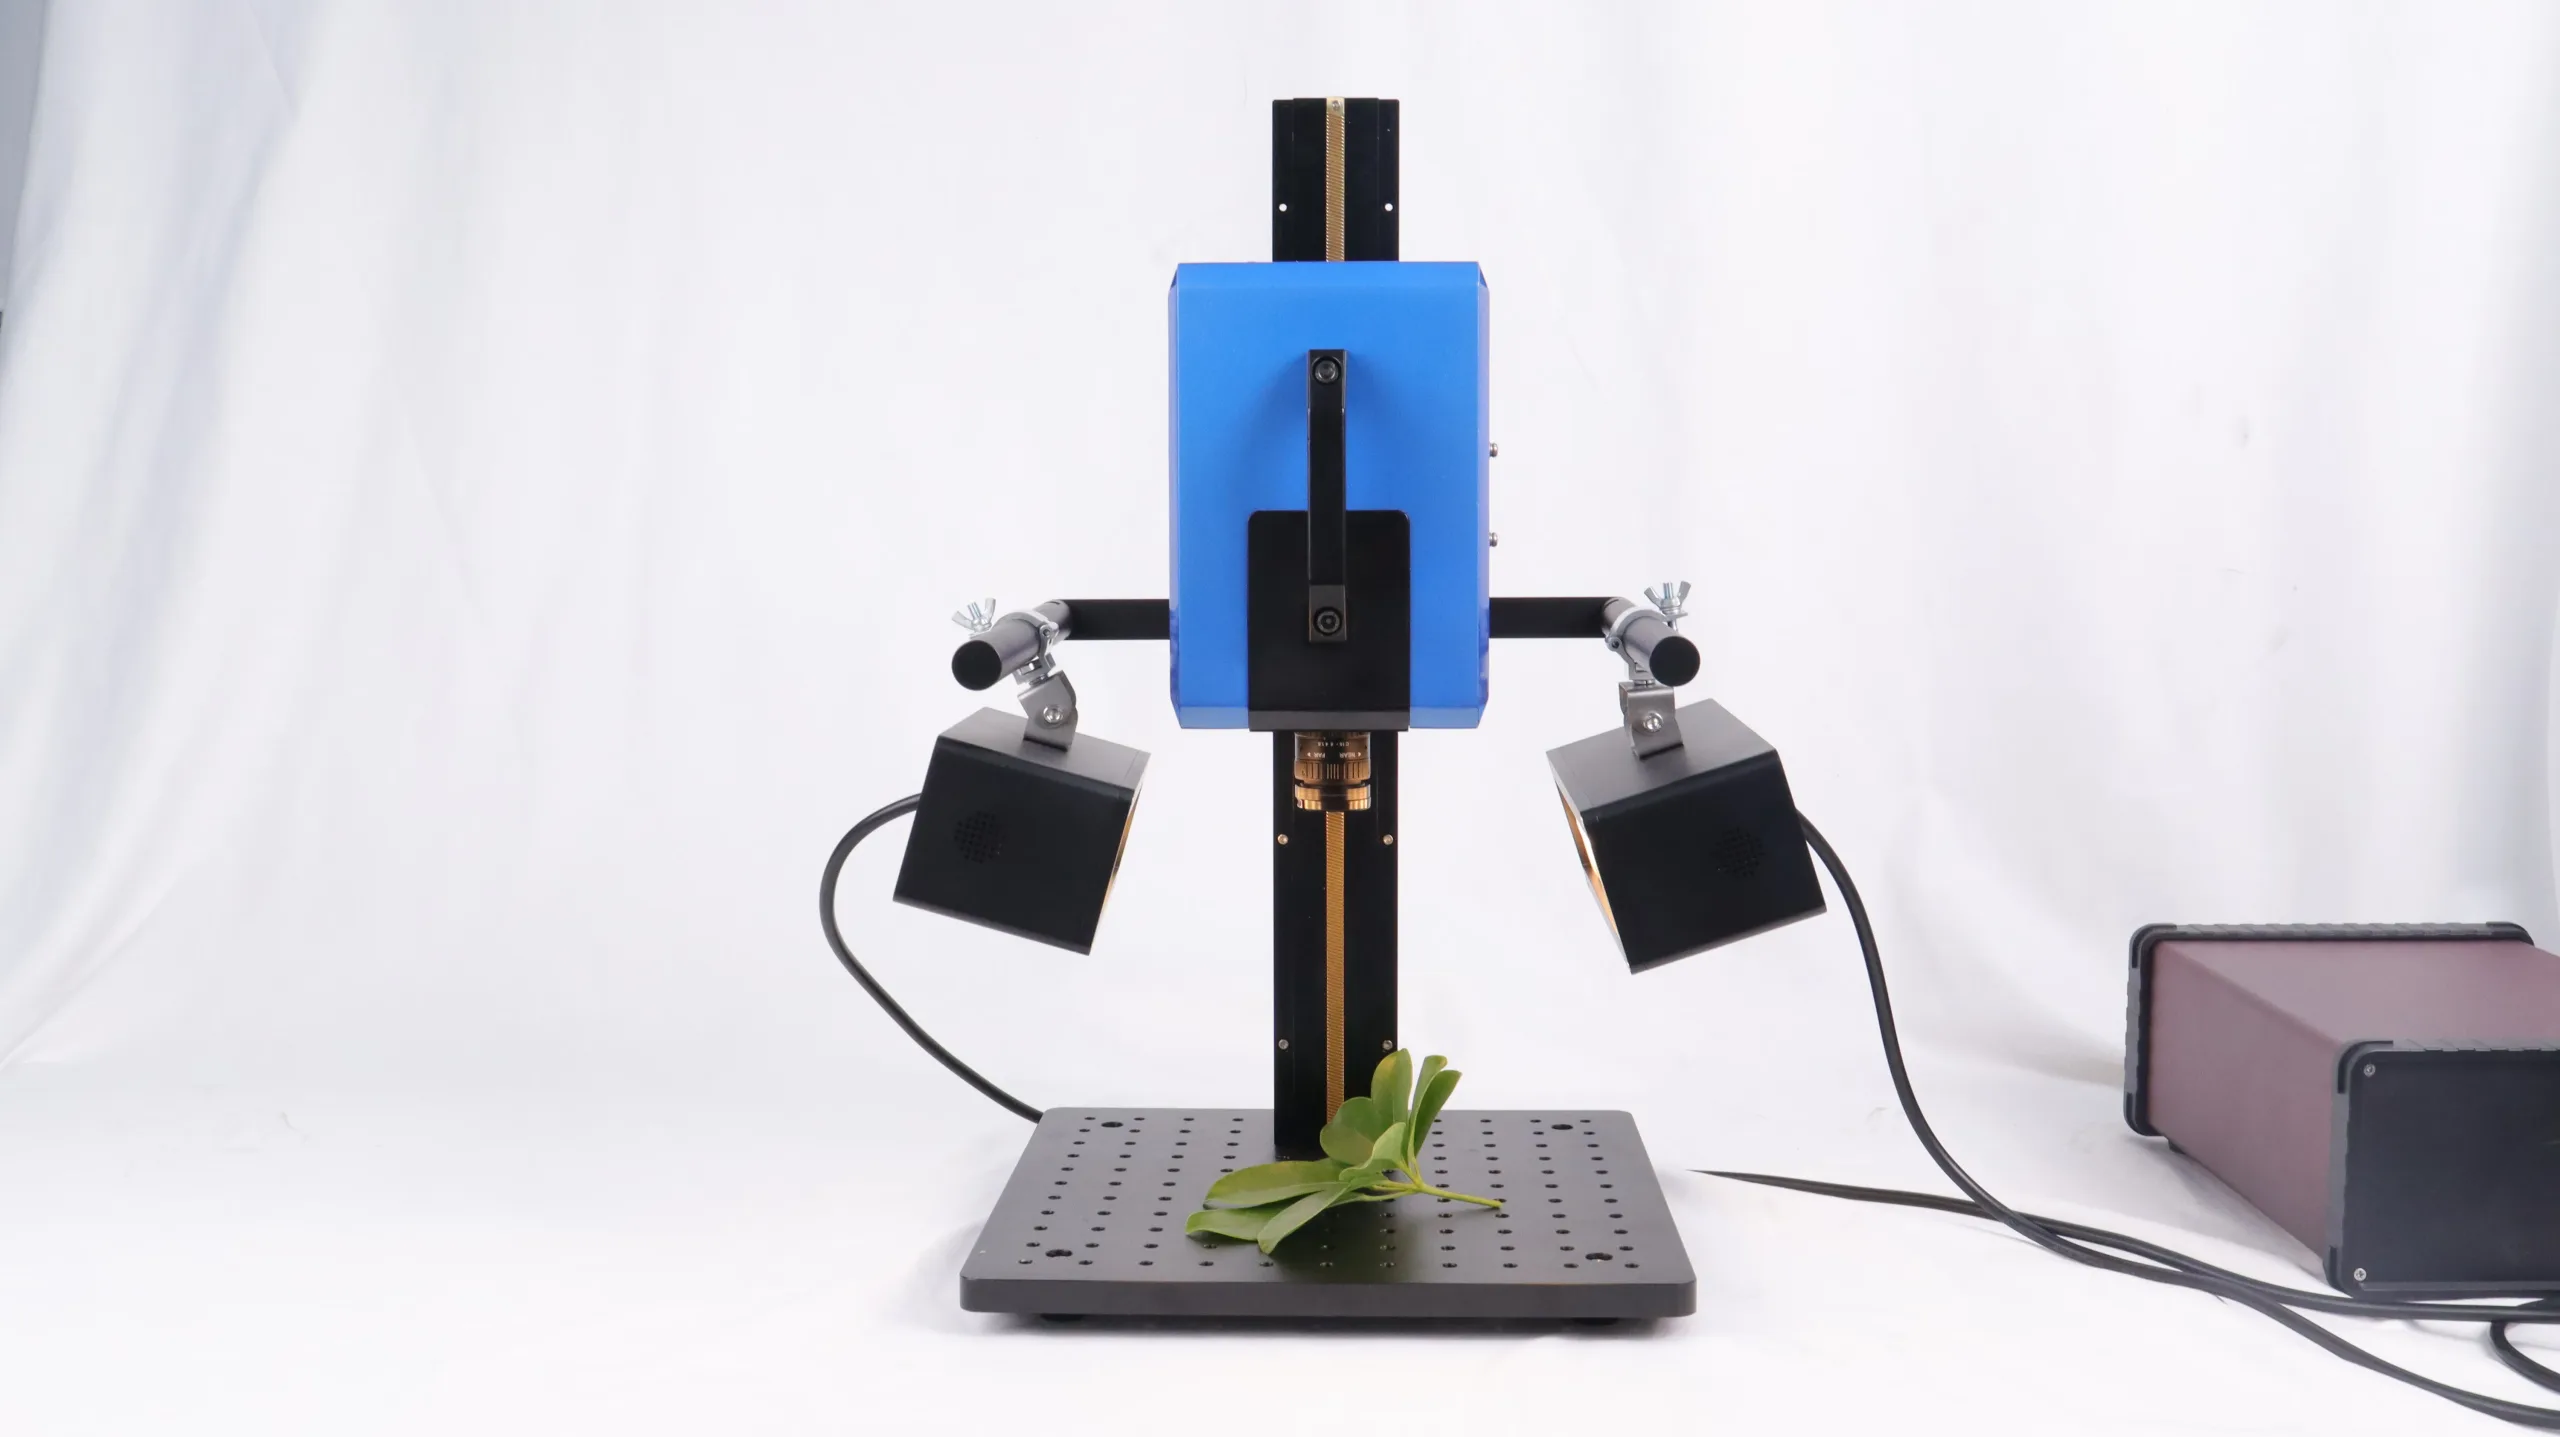
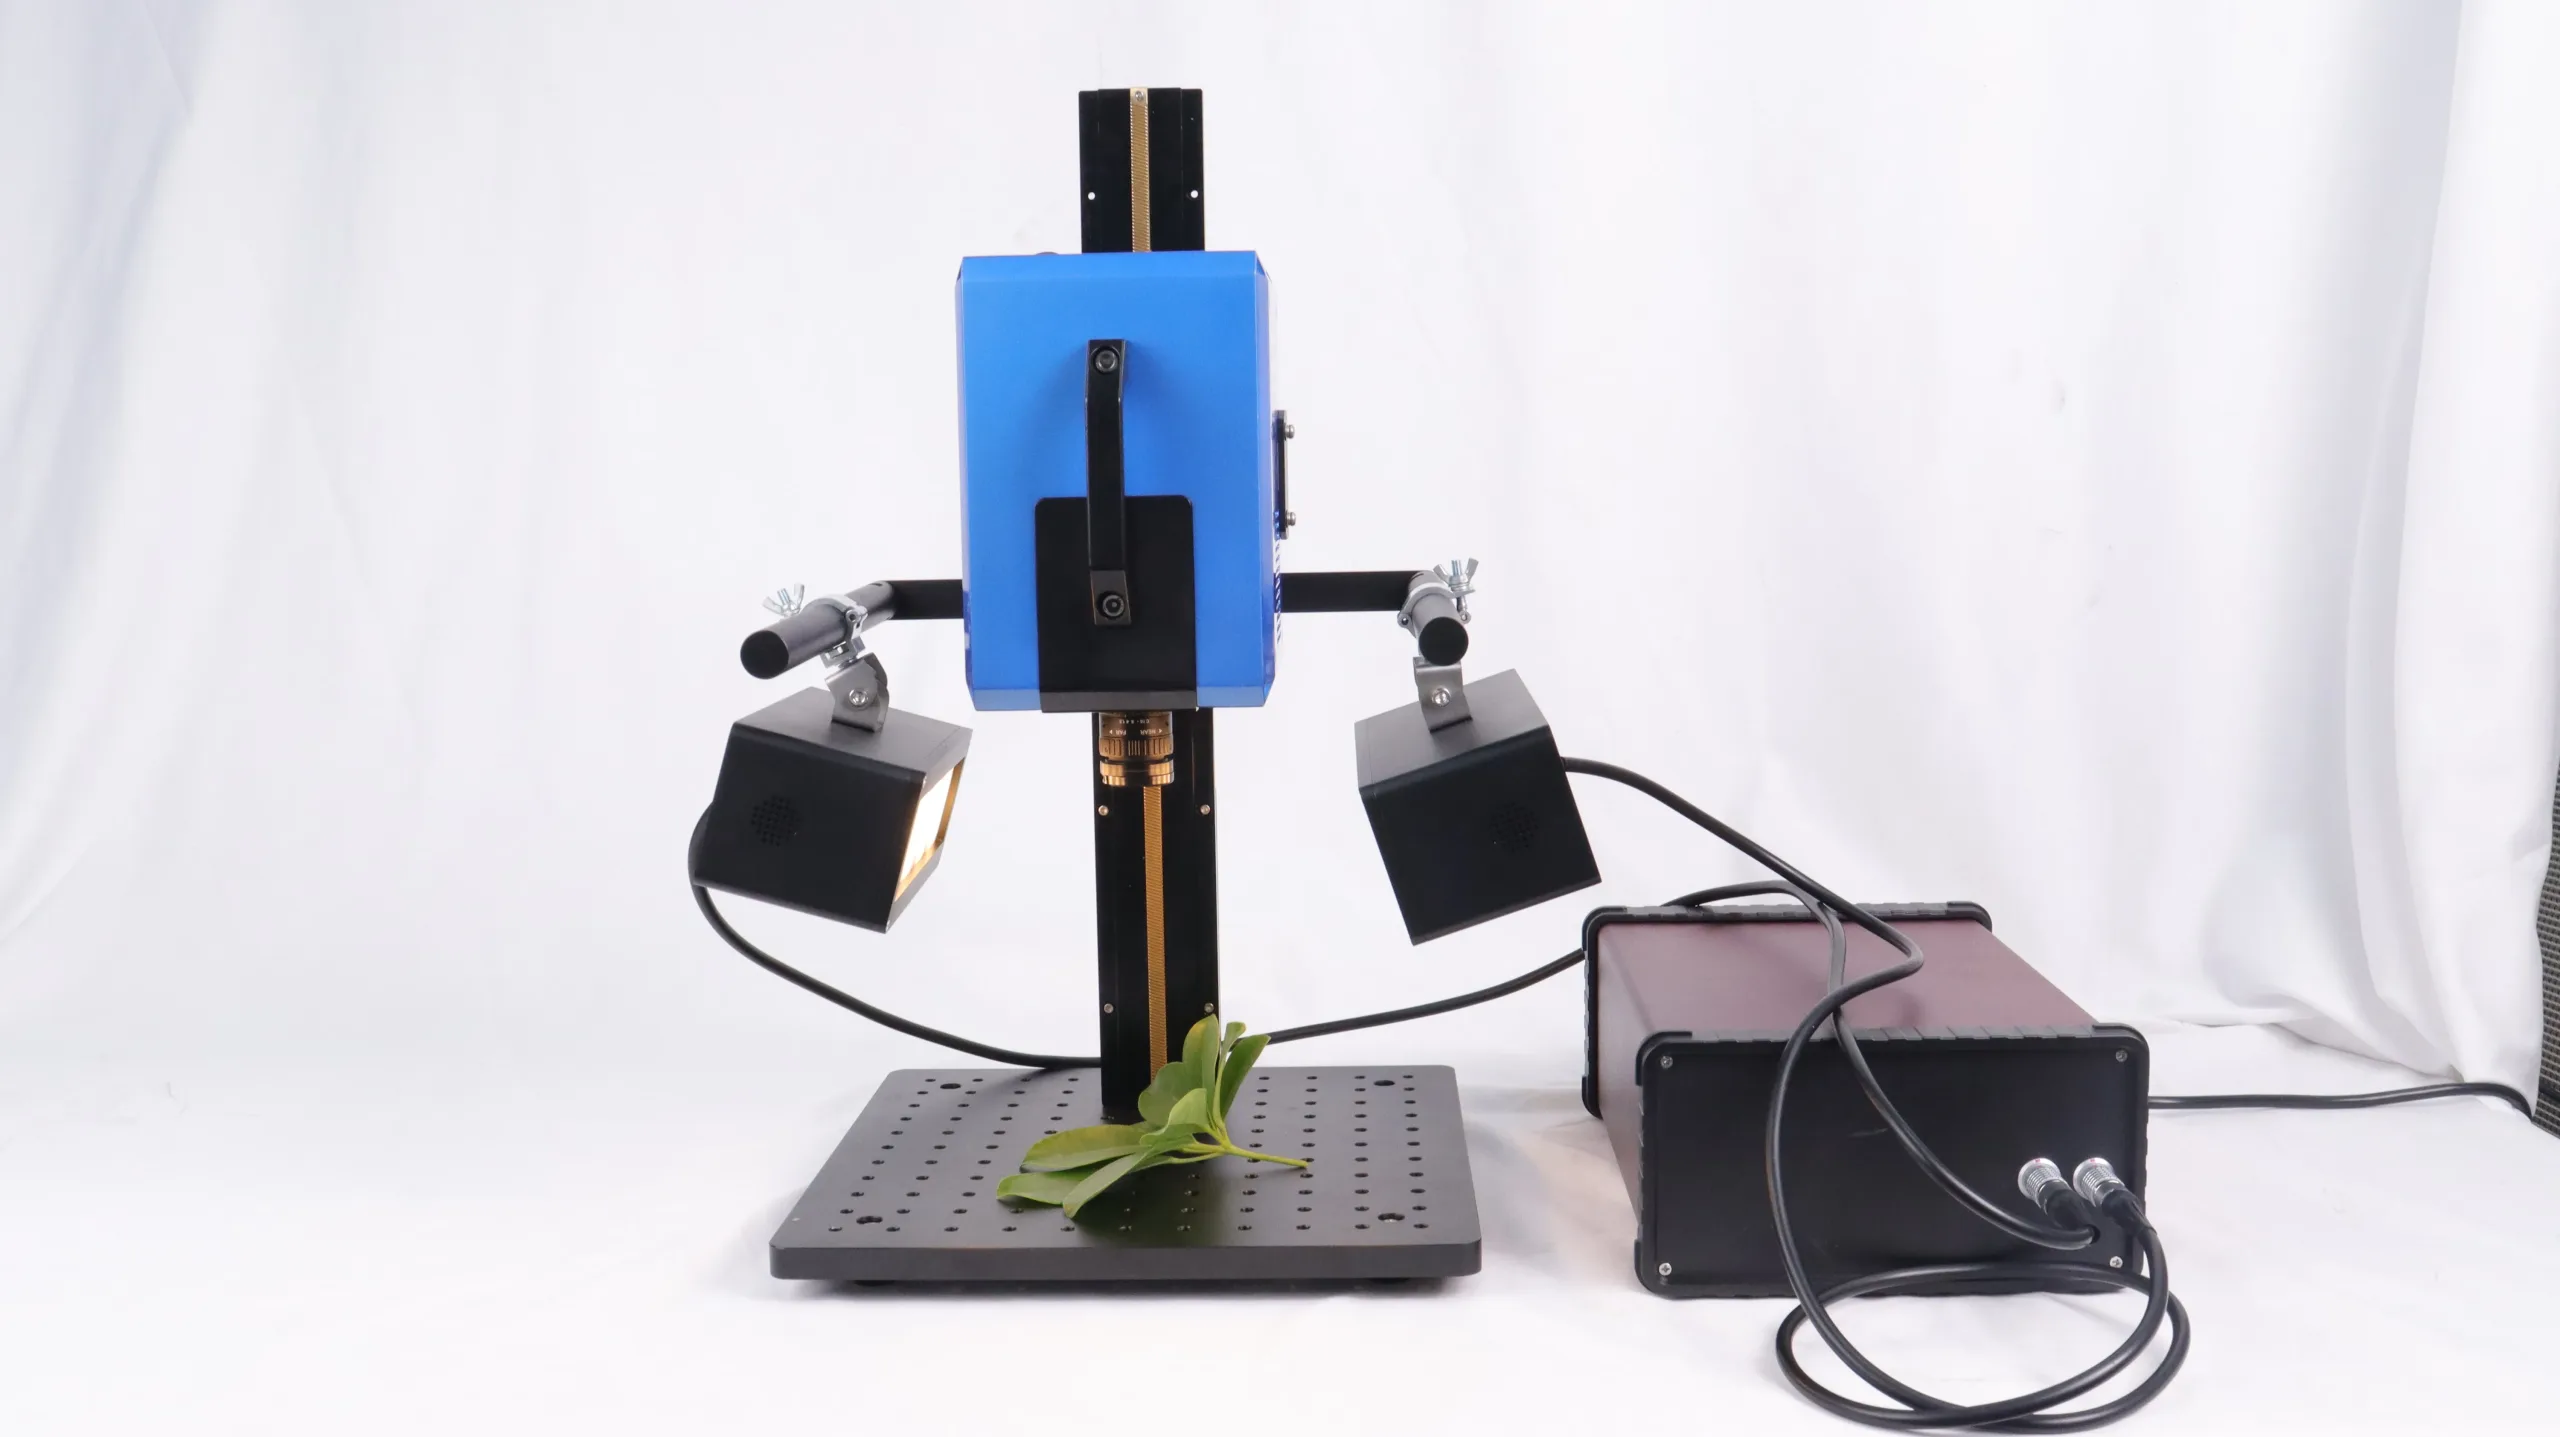
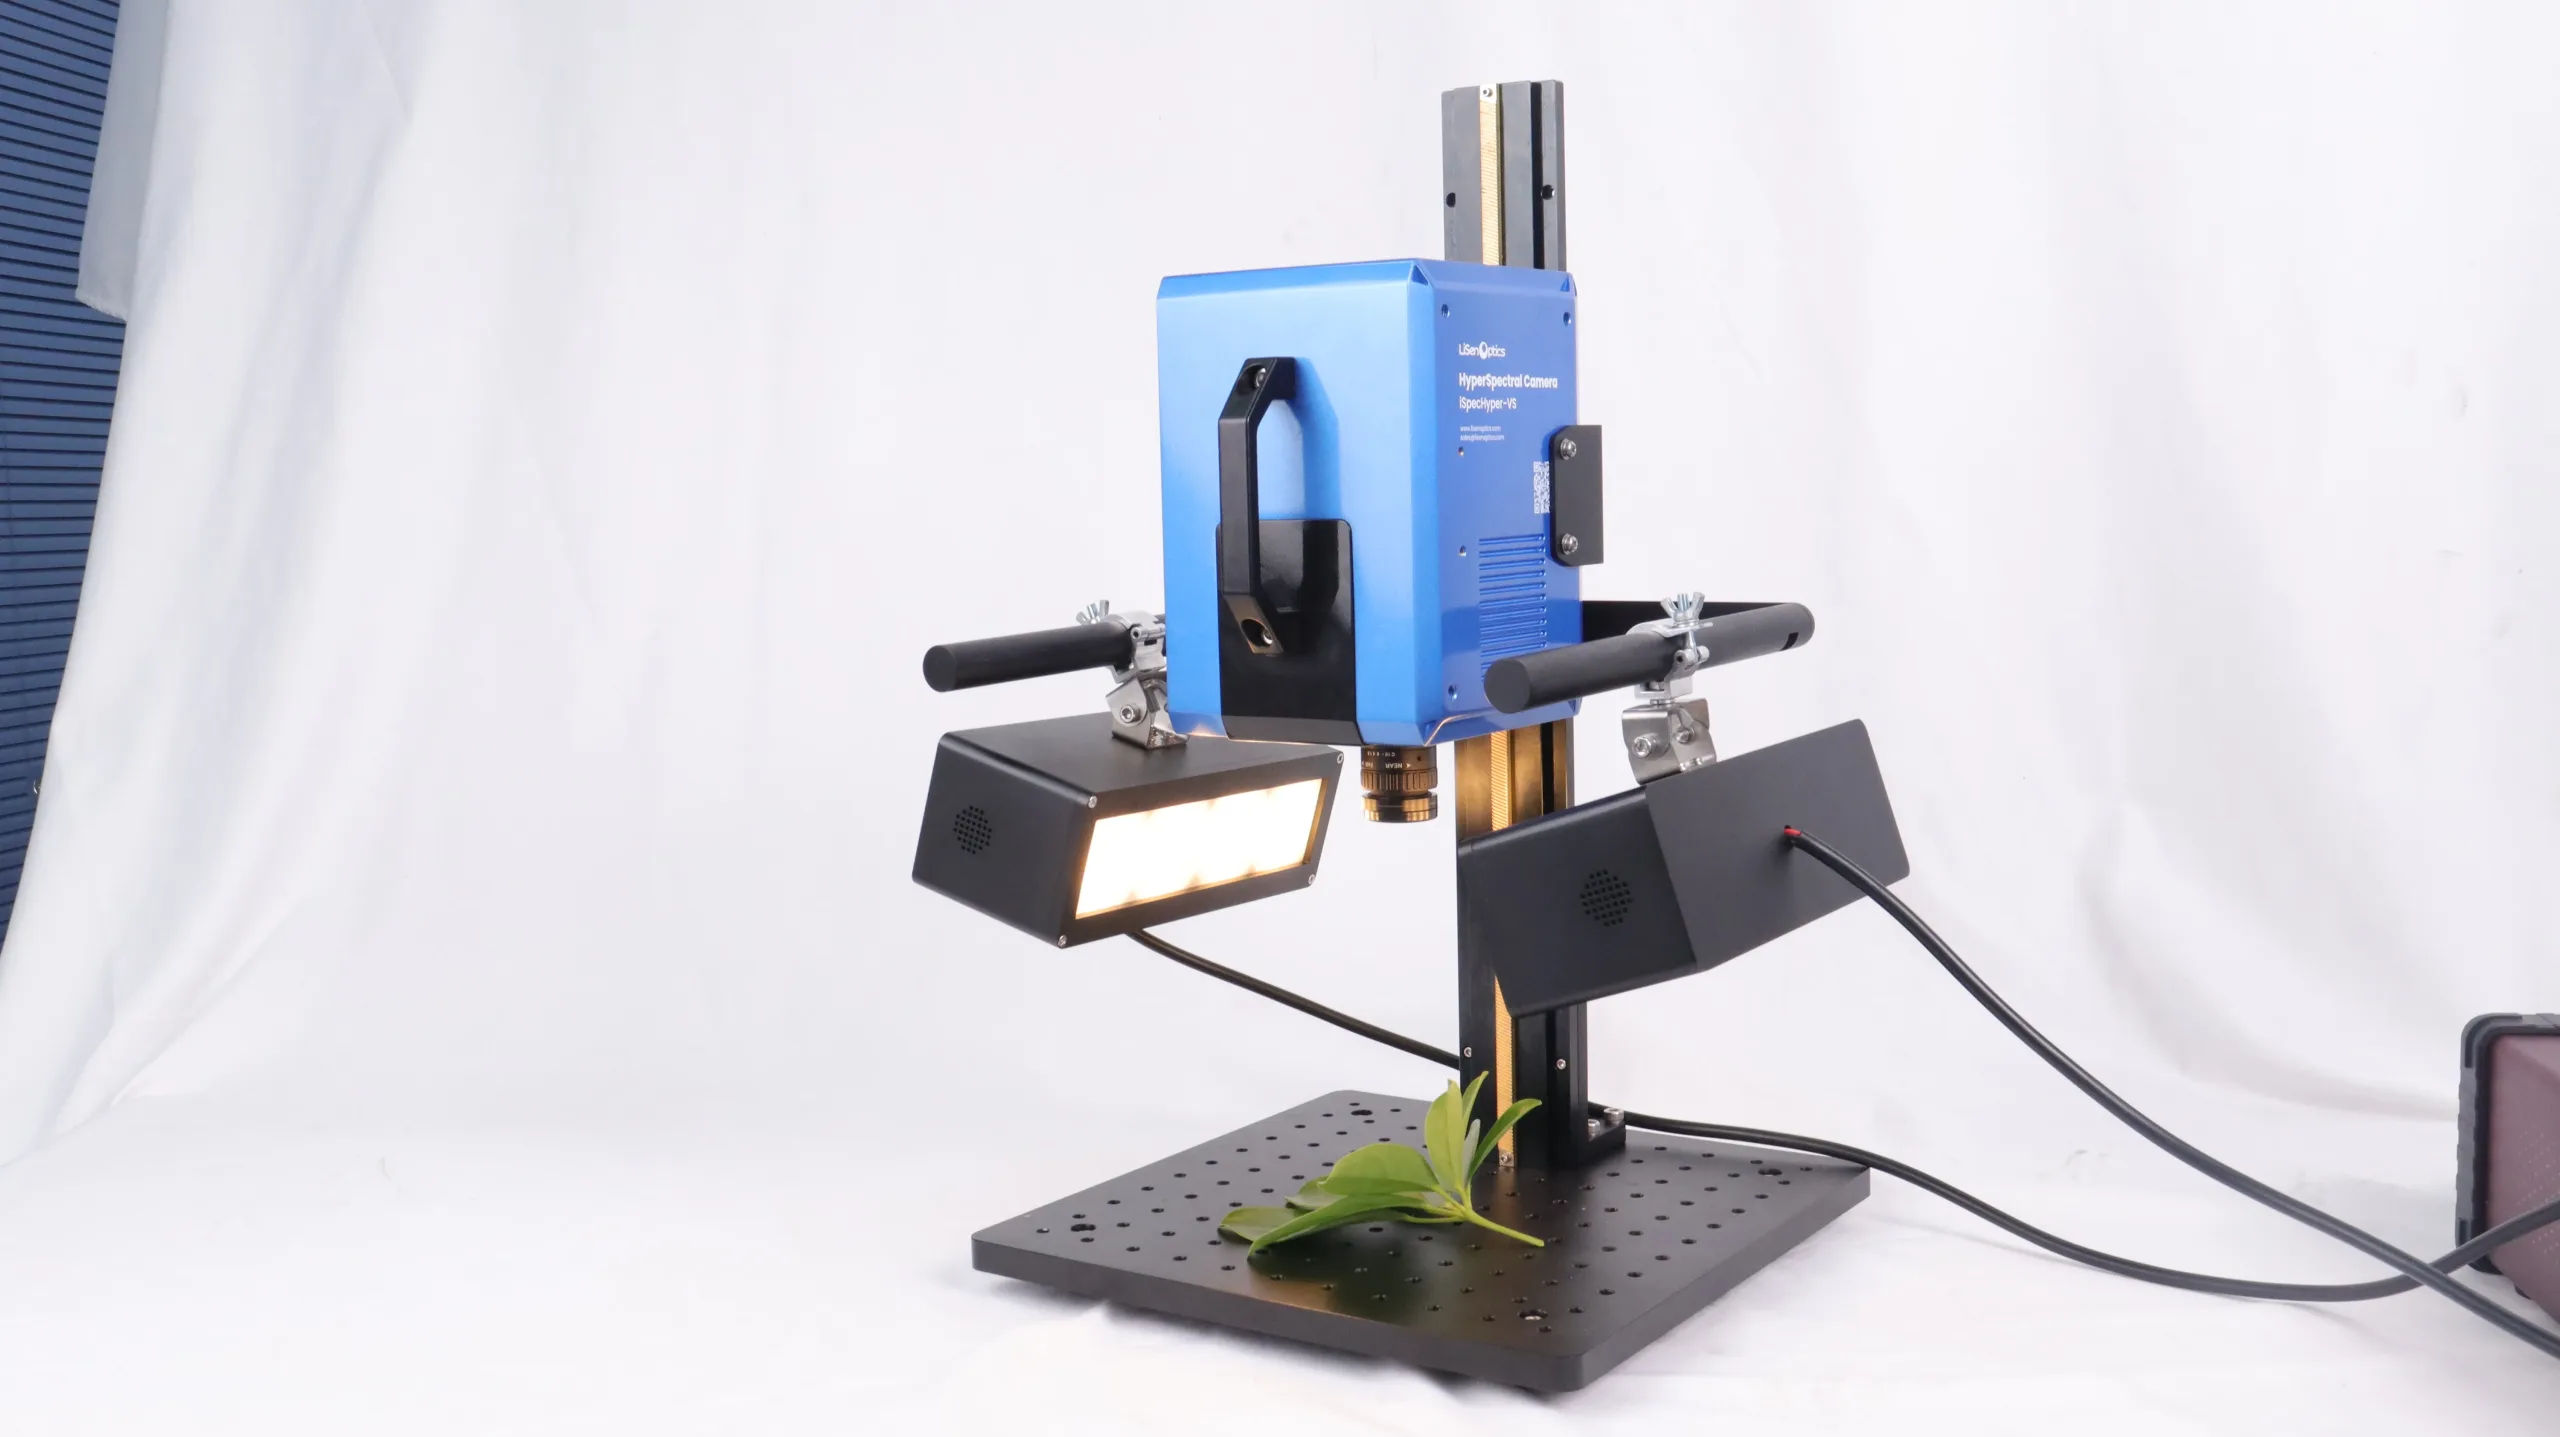
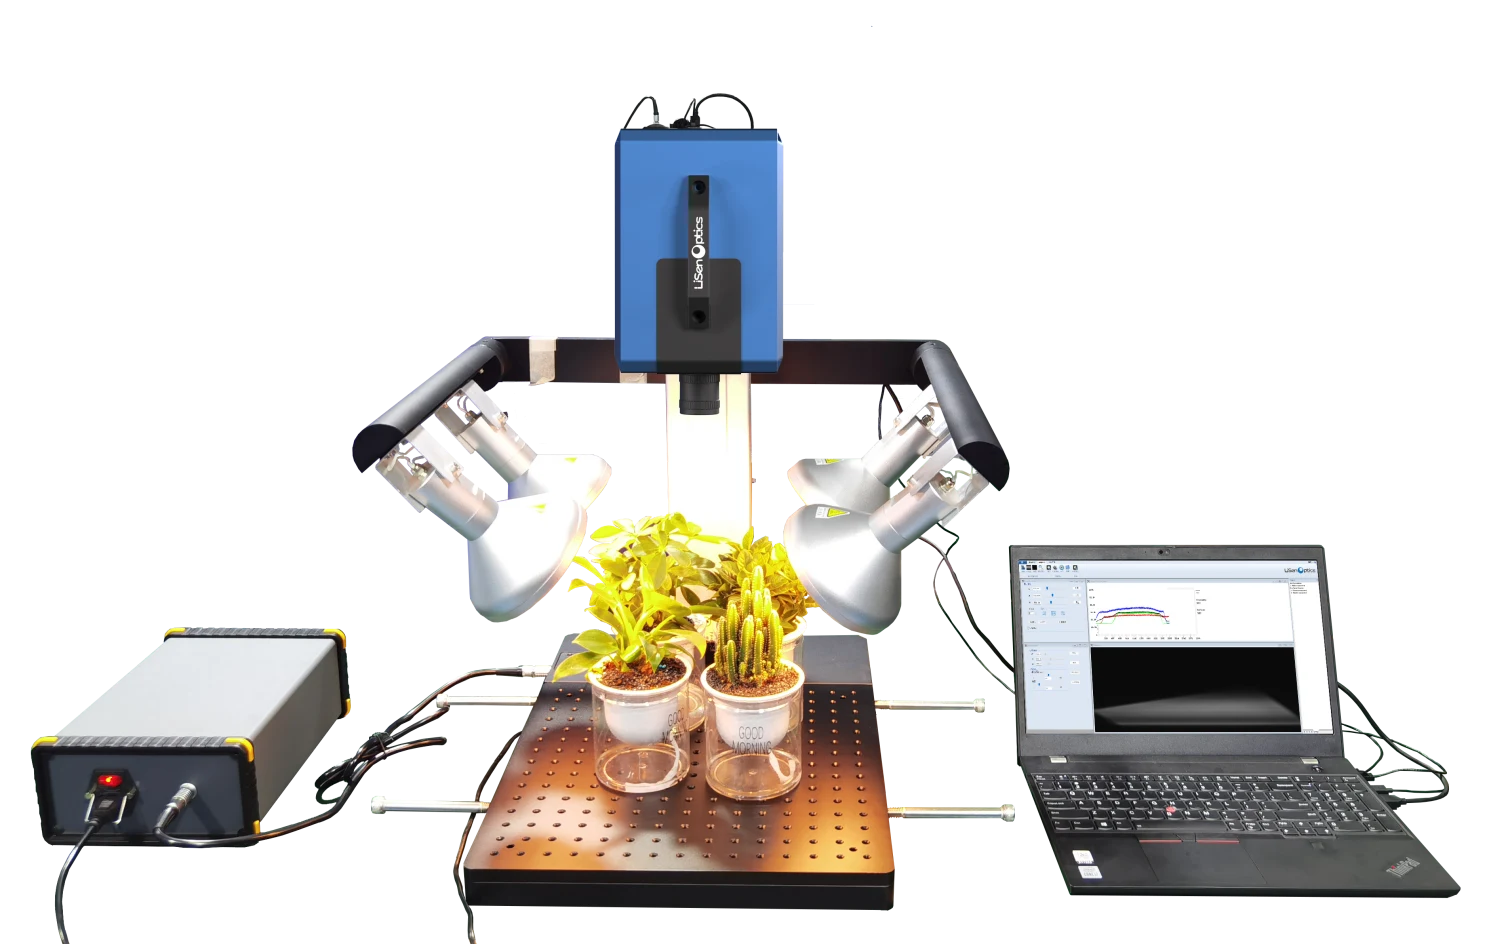
These product photographs show the camera mounted above a plant sample with two illuminators, a support stand, and an external control unit.
Technical Specifications
| Parameter | iSpecHyper-VS300-IND | iSpecHyper-VS300 |
|---|---|---|
| Product Image |
 |
 |
| Spectral Separation | Chip-coated gradient spectral filtering | Chip-coated gradient spectral filtering |
| Imaging Mode | Integrated internal push-broom scanning | Integrated internal push-broom scanning |
| Spectral Range | 400–1000 nm | 400–1000 nm |
| Spectral Channels | 128 / 256 / 512 / 1024 (selectable) | 128 / 256 / 512 / 1024 (selectable) |
| Spectral Resolution | ≤10 nm | ≤10 nm |
| Detector | 4504 × 4096-pixel CMOS | 4504 × 4096-pixel CMOS |
| Spatial Samples | 3200 (1×), 1600 (2×), 800 (4×) | 3200 (1×), 600 (2×), 800 (4×) |
| Optical Throughput | ≥85% | ≥85% |
| F-number | F/1.8–16 | F/1.8–16 |
| Pixel Pitch | 2.5 µm | 2.5 µm |
| Effective Bit Depth | 12-bit | 12-bit |
| Horizontal Scan Angle | >25° @ f = 25 mm | >25° @ f = 25 mm |
| Vertical Scan Range | >25° @ f = 25 mm | >25° @ f = 25 mm |
| Standard Lens Focal Length | 25 mm | 25 mm |
| Optional Focal Lengths | Manual lenses: 8 / 16 / 25 / 35 mm; Motorized lens: N/A | Manual lenses: 8 / 16 / 25 / 35 mm; Motorized lens: N/A |
| Working Distance | 150 mm to ∞ with 15 mm lens | 150 mm to ∞ with 15 mm lens |
| Acquisition Time | 2–4 min | 2–4 min |
| Lens Mount | C-Mount | C-Mount |
| Data Interface | USB 3.0 | USB 3.0 |
| Auxiliary Focusing Camera | 5 MP | 5 MP |
| Laser Rangefinder | No | No |
| Focus | Manual focus | Manual focus |
| Power | External power supply | External power supply / built-in Li-ion battery (2–3 h) |
| Data Acquisition System | iSpecHyper-View acquisition software; CPU: Intel Core i5; Memory: 16 GB; Storage: 512 GB | iSpecHyper-View acquisition software; CPU: Intel Core i5; Memory: 16 GB; Storage: 512 GB |
| Operating Temperature | 0 to 40 °C | 0 to 40 °C |
| Storage Temperature | 0 to 50 °C | 0 to 50 °C |
| Weight | <1 kg | <2 kg |
Acquisition Software
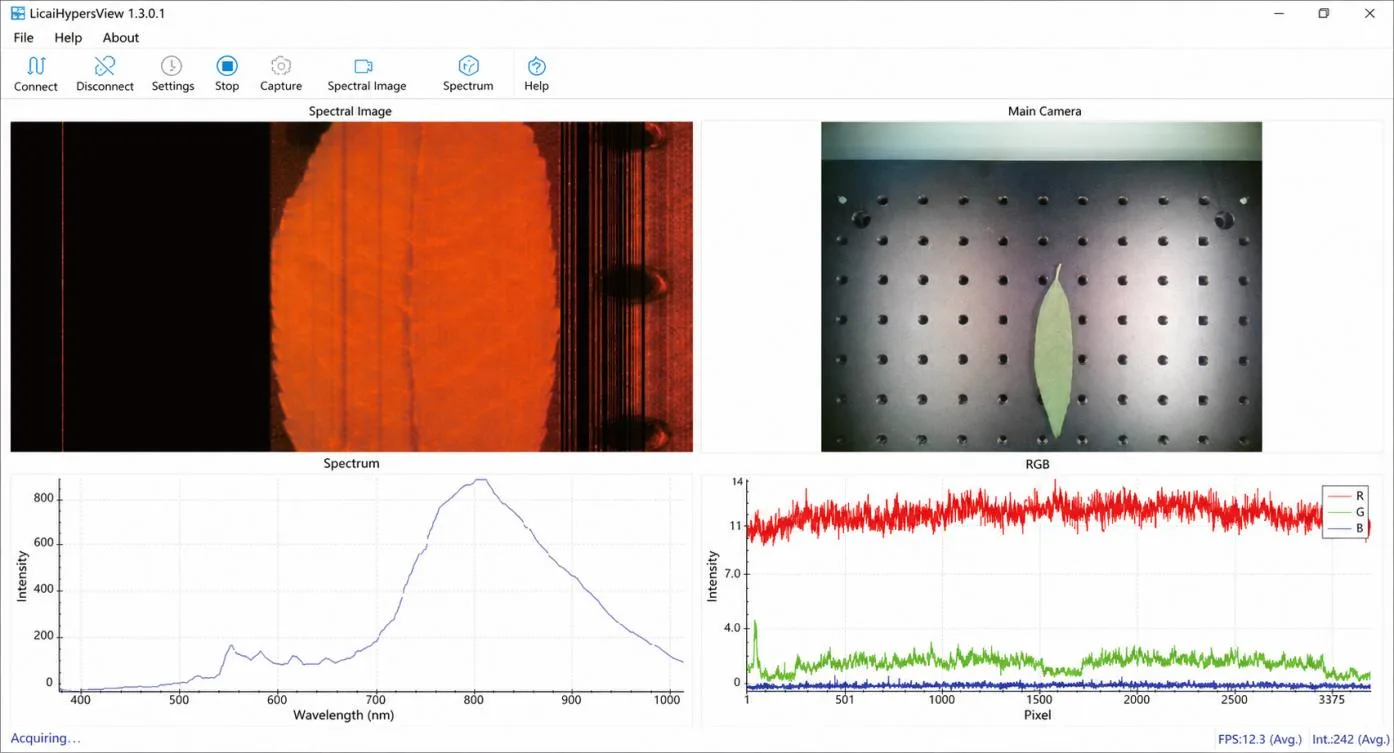
The iSpecHyper-View acquisition software provides spectral imaging and analysis with USB 3.0 data transfer. The specified acquisition computer has an Intel Core i5 processor, 16 GB of memory, and 512 GB of storage. The interface below shows the spectral image, auxiliary camera view, spectrum, and RGB traces.
Mechanical Dimensions
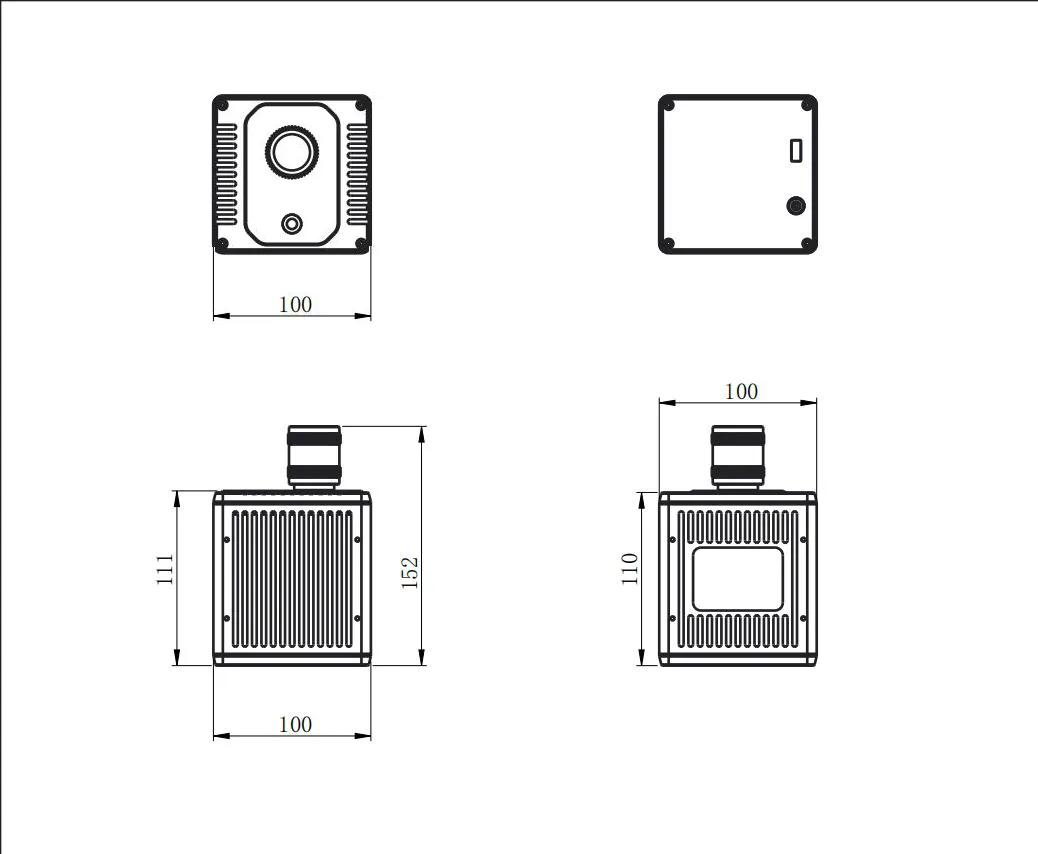
iSpecHyper-VS300-IND
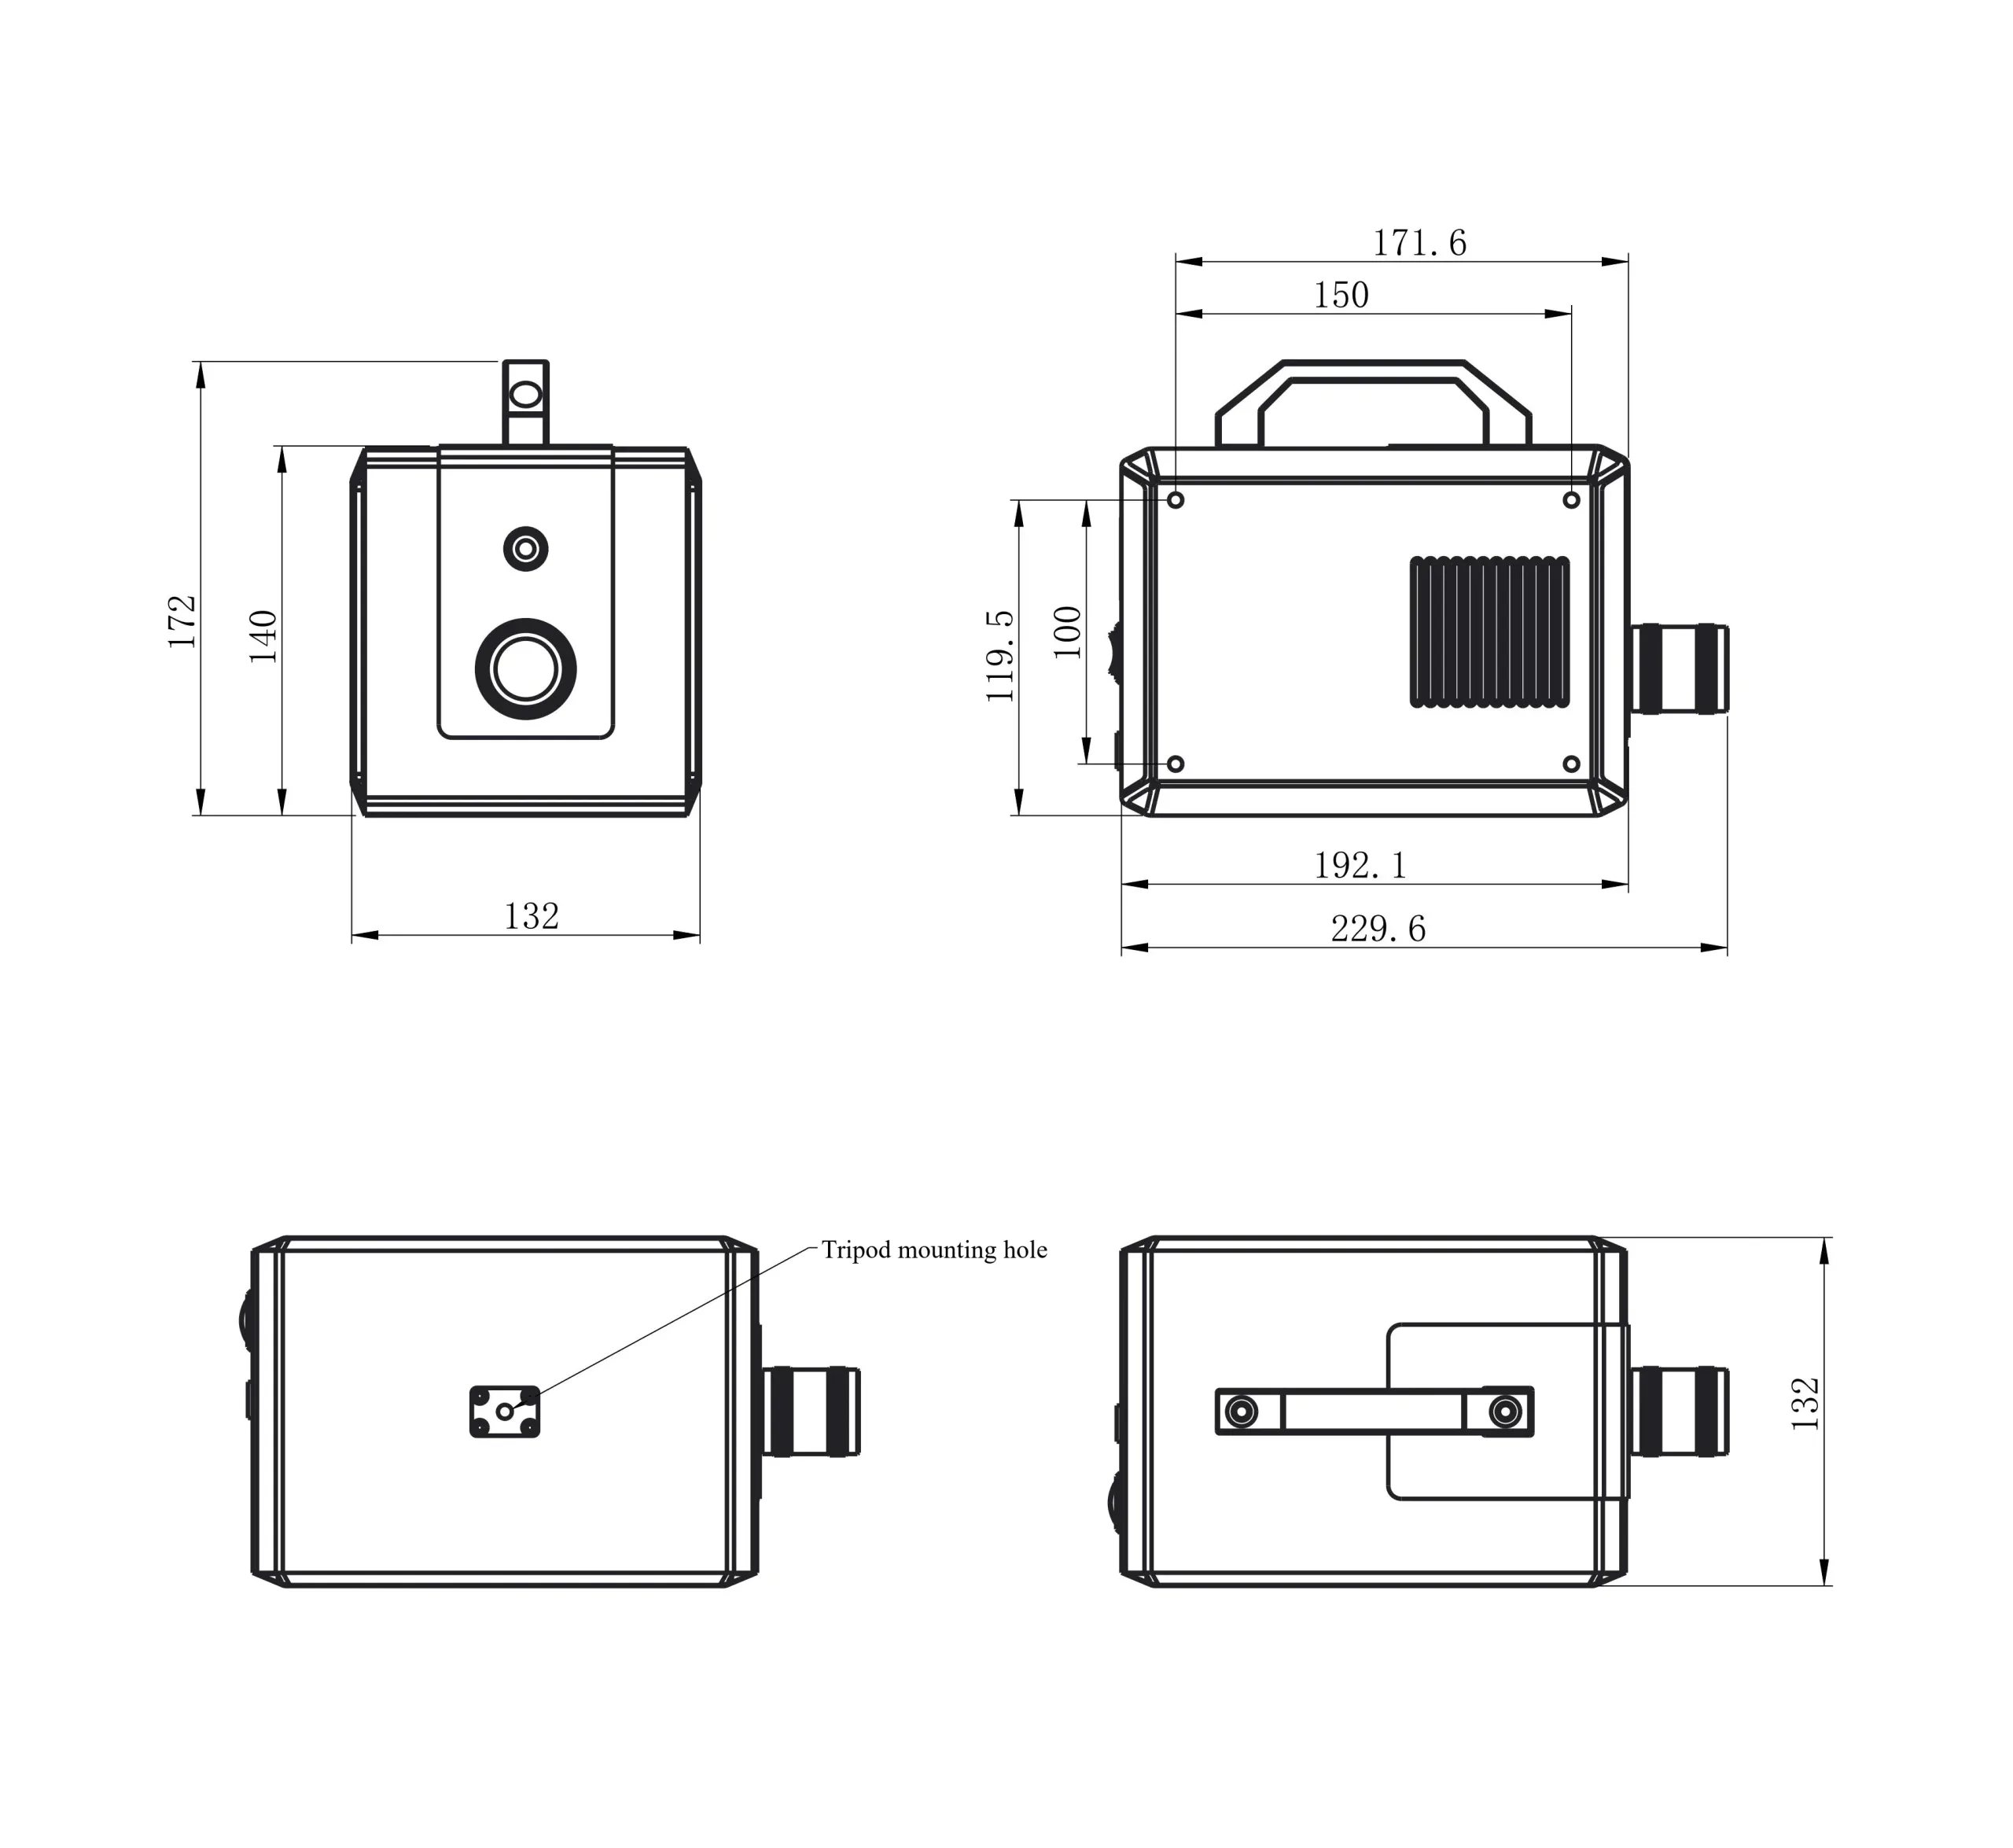
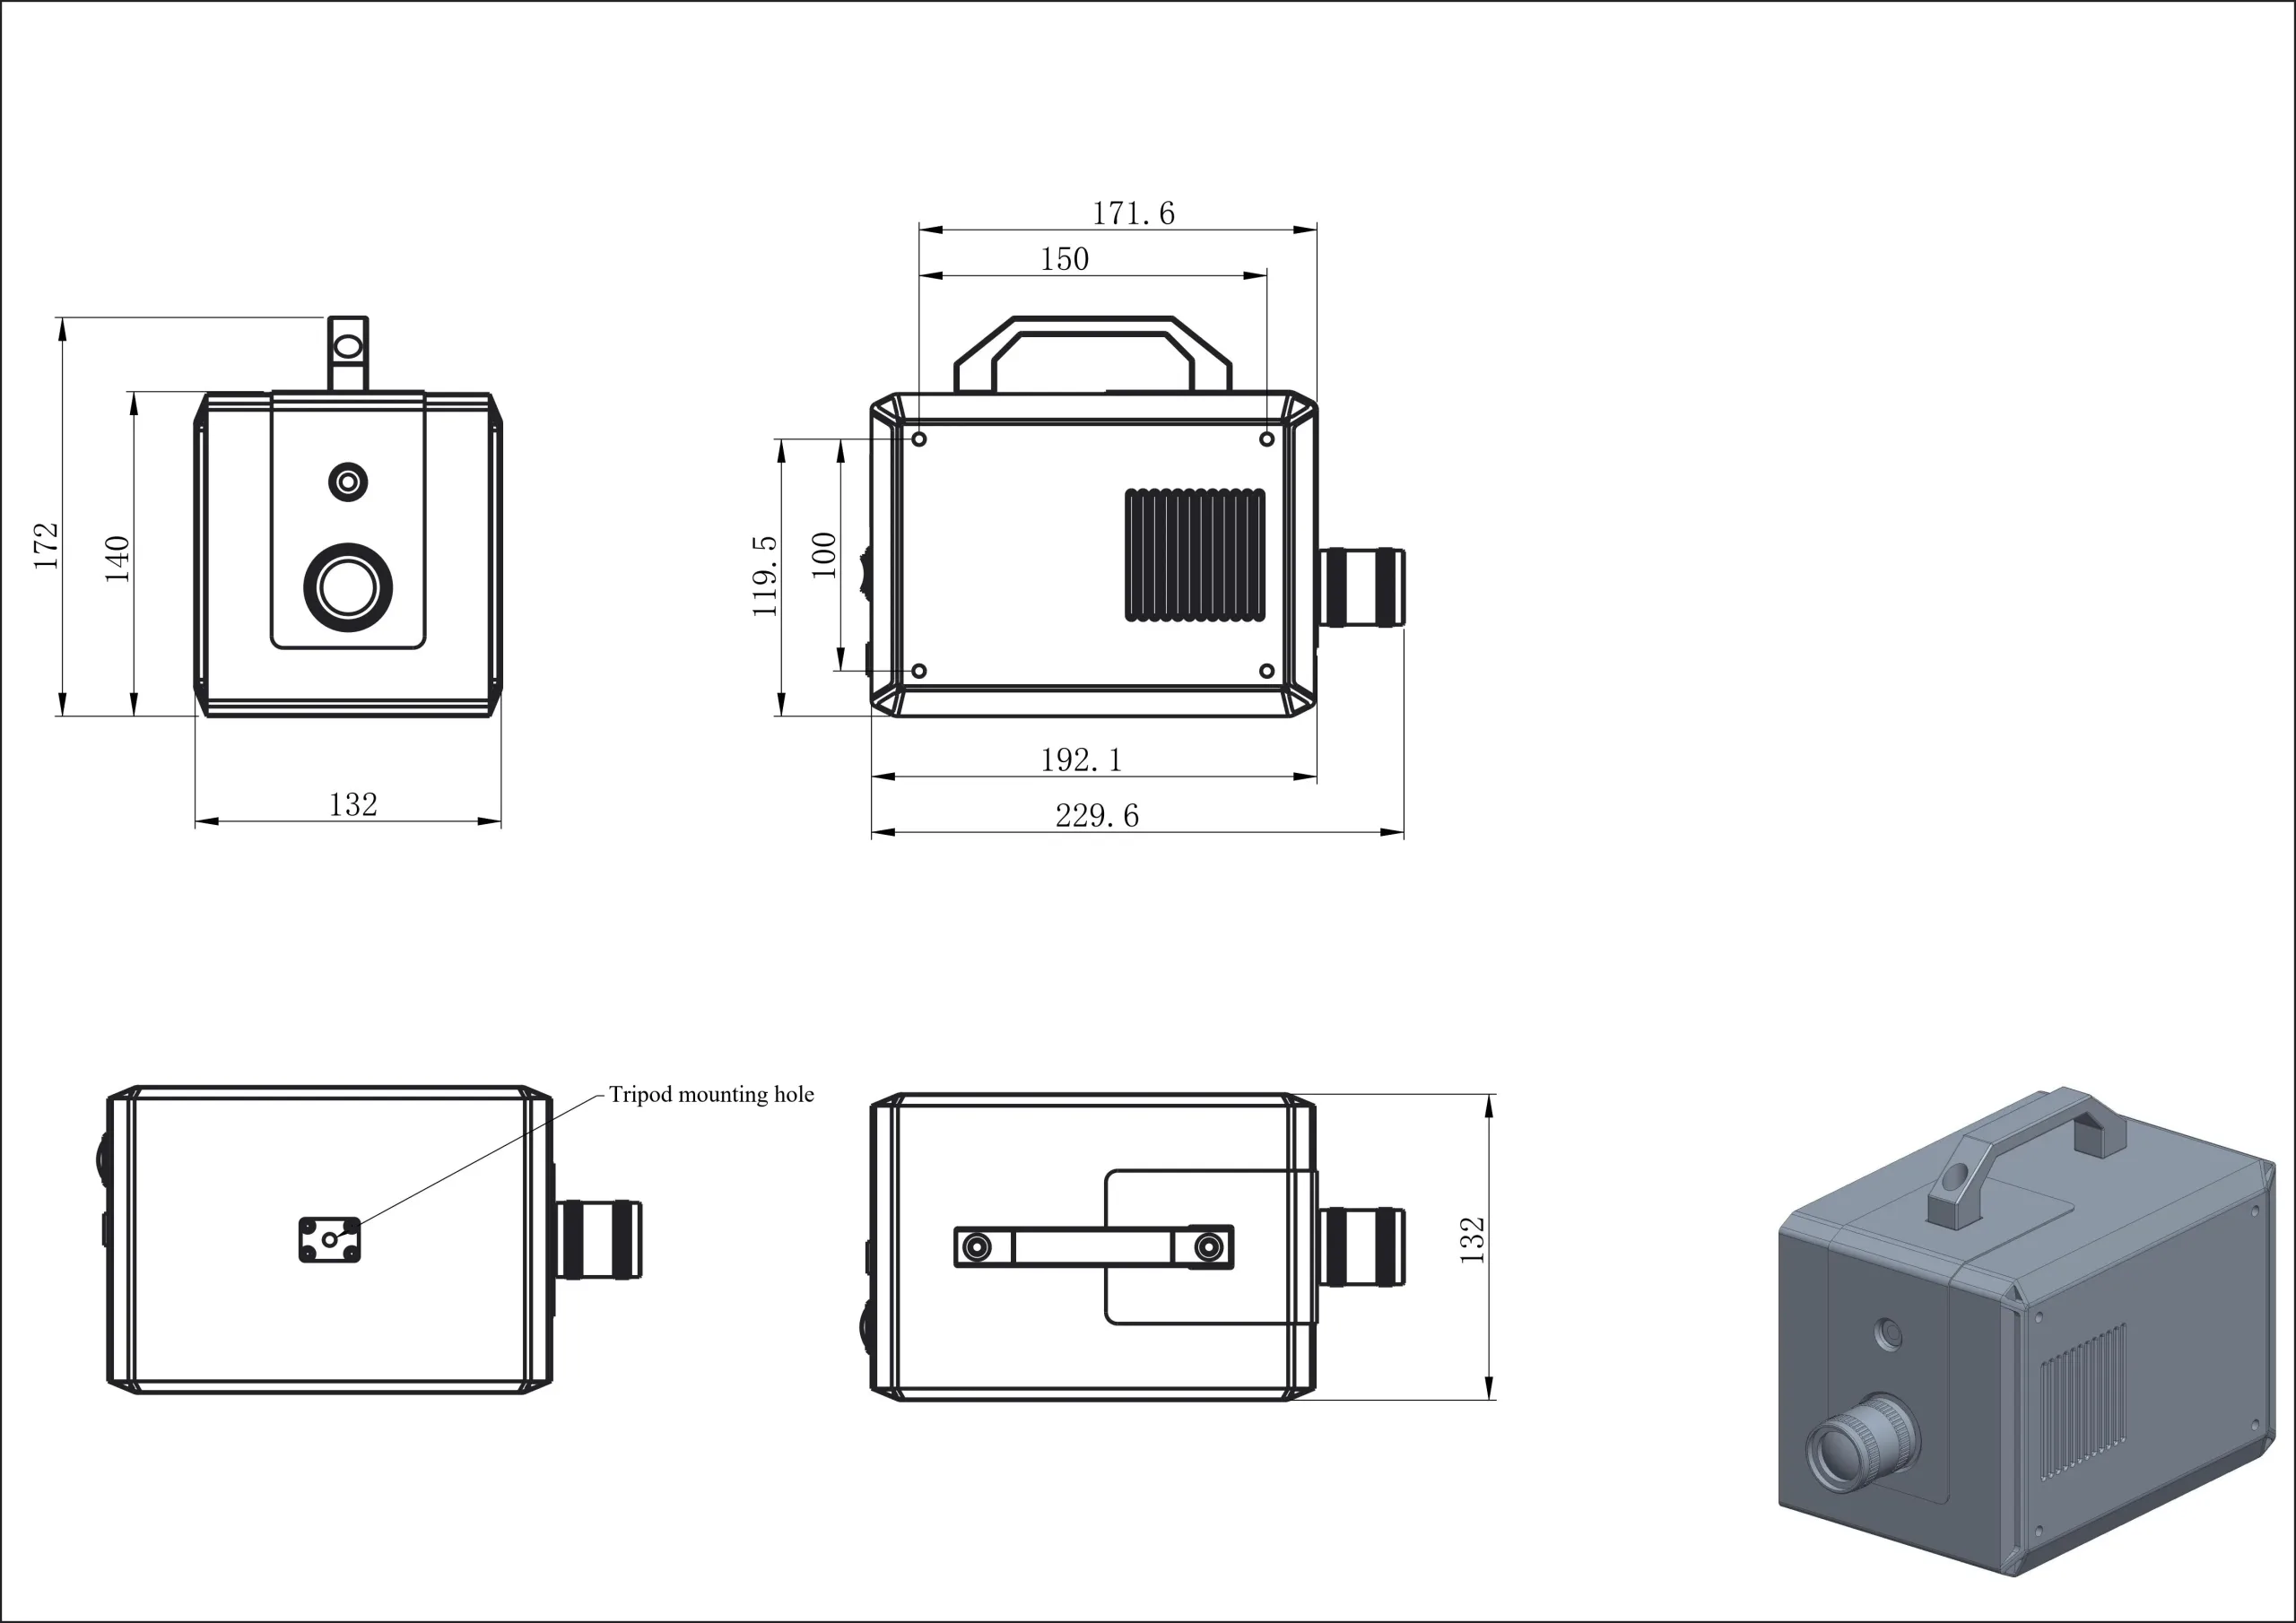
iSpecHyper-VS300
Hyperspectral Imaging Applications
The following application and research examples illustrate how hyperspectral imaging combines spatial information with spectral measurements. The cited studies describe their own instruments and experimental conditions.
Fruit Sorting
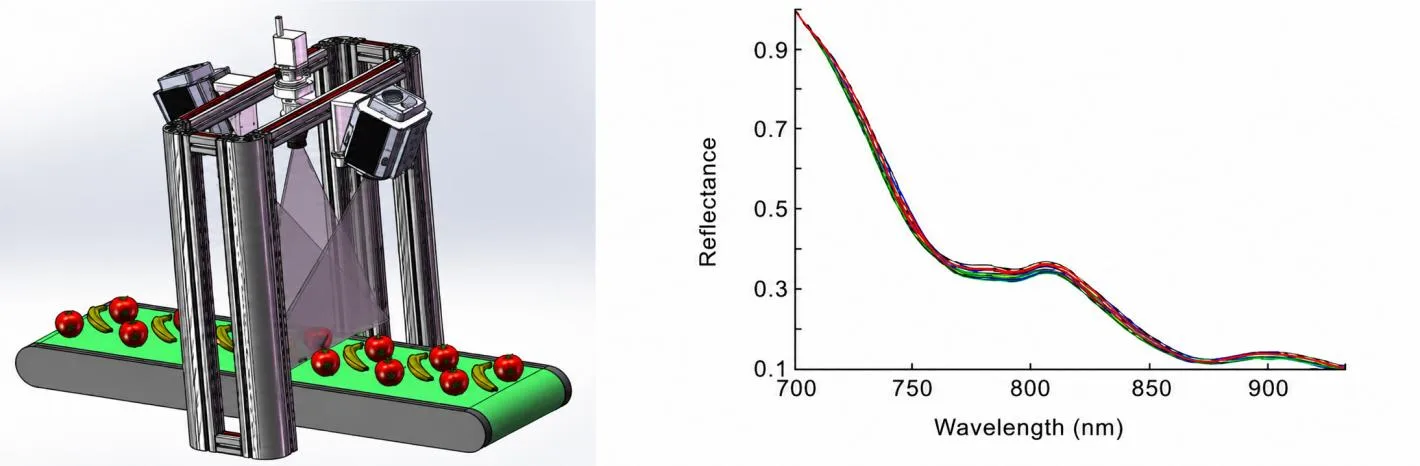
Rapid, nondestructive fruit inspection supports automated grading and processing. Hyperspectral imaging captures signatures associated with physiological, chemical, and physical properties. For many fruits, quality-related signatures are concentrated in the 650–950 nm region, with sugar-related features reported around 700–820 nm and 750–900 nm. These signatures can support sorting and quality classification.
In an in-line fruit-sorting configuration, the conveyor supplies the relative motion required for push-broom imaging. The camera is mounted above the belt on a gantry and paired with a dedicated line illuminator. A typical system includes the camera and mount, line light source, control module, positioning sensors, and a computer running acquisition and control software.
Blood Oxygenation Research
The 2015 study Hyperspectral optical tomography of intrinsic signals in the rat cortex investigated intrinsic signals in rat cortex. It examined changes associated with oxyhemoglobin and deoxyhemoglobin at 529 and 630 nm, respectively, and developed a diffuse optical tomography (DOT) approach to assess blood oxygenation.
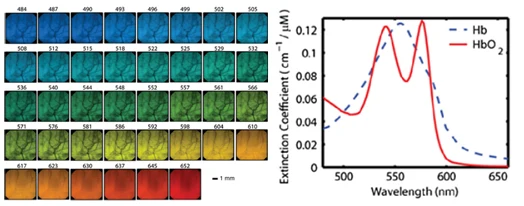
Research example: Konecky et al., 2015.
Photosynthesis Research
The 2017 study Kleptoplast photosynthesis is nutritionally relevant in the sea slug Elysia viridis used hyperspectral imaging to investigate chloroplast abundance, distribution, and photosynthetic activity. Chloroplast abundance decreased markedly after 24 days of starvation in darkness, helping researchers study how retained chloroplasts are used under limited energy supply.
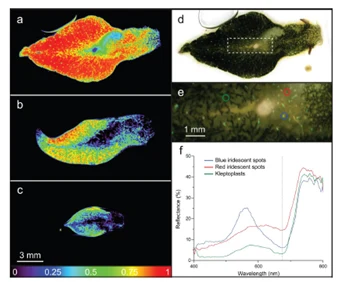
Research example: Cartaxana et al., 2017.
Biomedical Imaging
The 2012 paper Hyperspectral imaging and spectral-spatial classification for cancer detection evaluated prostate-cancer detection using a least-squares support vector machine (LS-SVM) classifier. Spatially resolved maps distinguished the reflectance characteristics of tumor and normal tissue. Preliminary mouse-model results demonstrated tumor detection and the potential of hyperspectral imaging as an optical diagnostic tool.
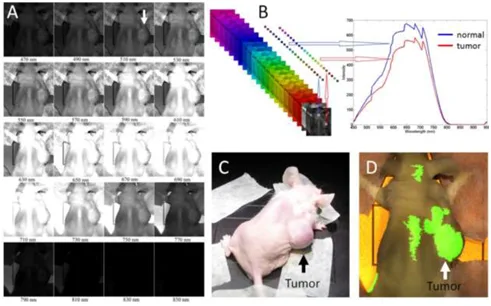
Research example: Fei, Akbari, and Halig, 2012.
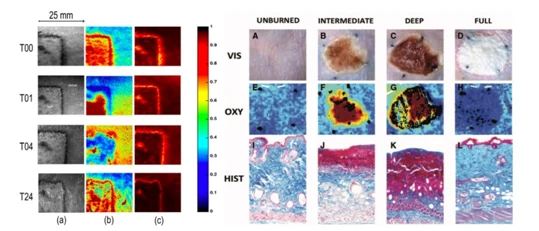
Two 2015 studies using porcine and nude-mouse models investigated burn classification and recovery with hyperspectral imaging. The figures show oxygen-saturation and hemoglobin distributions at T00, T01, T04, and T24, alongside color, oxyhemoglobin, and histology images. These studies illustrate the potential for nondestructive, noncontact burn-depth assessment with high throughput.
Biological Species Classification
The 2013 study Non-Invasive Measurement of Frog Skin Reflectivity in High Spatial Resolution Using a Dual Hyperspectral Approach used two push-broom imaging systems covering 400–2500 nm to examine three arboreal frog species. Although all three appeared green to the human eye, their reflectance differed substantially between 700 and 1100 nm, allowing species discrimination.
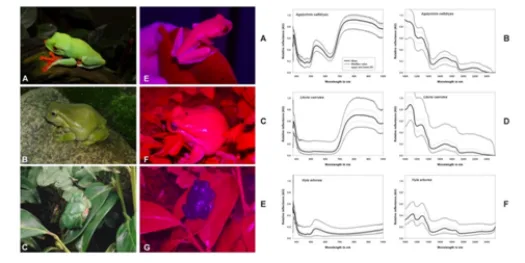
Research example: Pinto et al., 2013.
Cultural Heritage and Archaeology
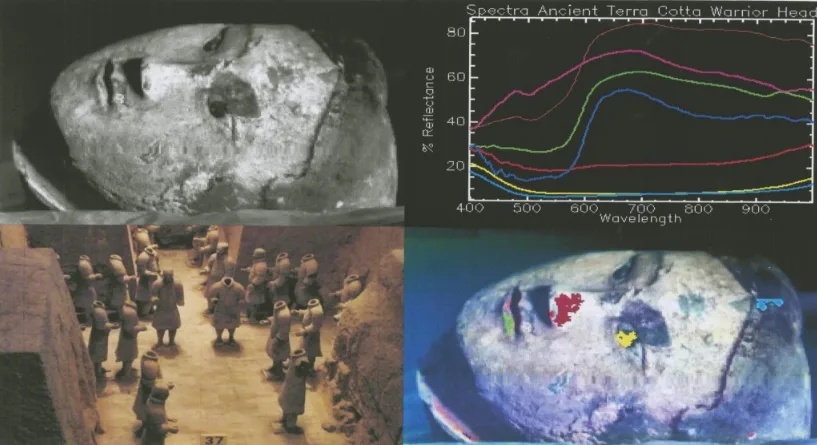
Since their discovery in 1974, the Terracotta Warriors have required careful conservation after more than two millennia underground. Noncontact hyperspectral measurements can help assess surface deterioration and characterize pigments, supporting documentation, conservation planning, and restoration studies.
Crop Classification and Identification
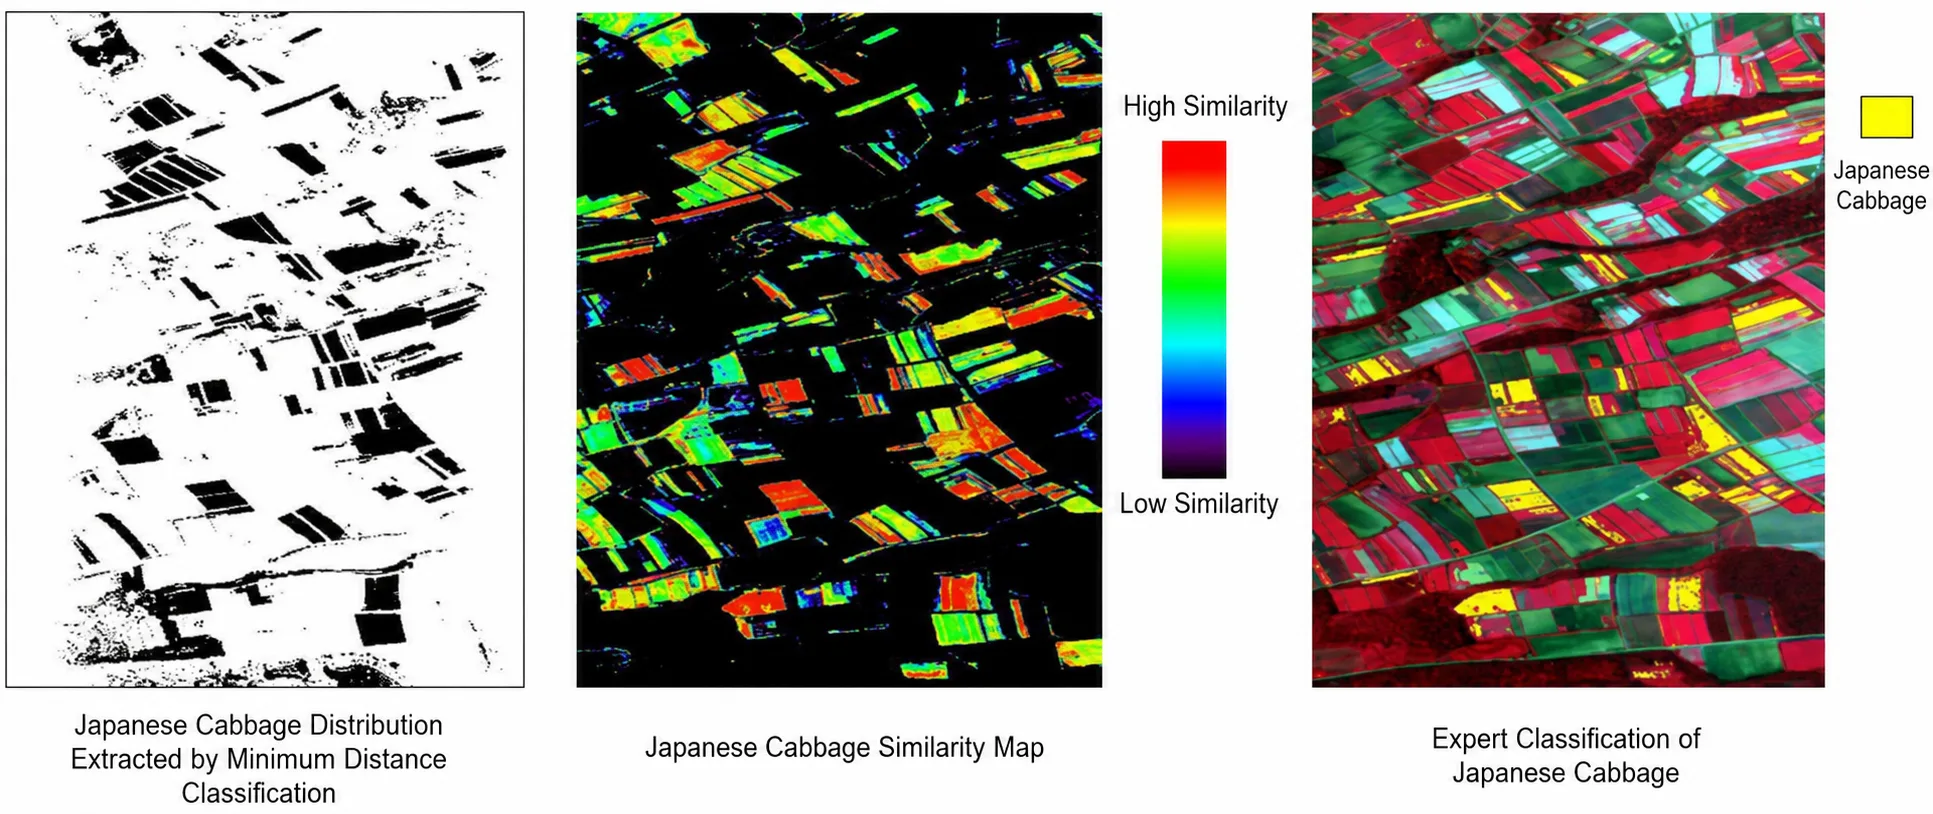
Narrow spectral bands resolve subtle differences between crops and support detailed classification and feature extraction. Common approaches include Spectral Angle Mapper (SAM) and hierarchical decision-tree classification.
In one rice-growth study in Changzhou, a hybrid decision-tree method classified six rice cultivars with a reported accuracy of 94.9%. An expert decision-tree approach using optimized spectral features was also applied to crops in Nanmoku, Japan, improving pixel-level accuracy while reducing classification noise.
Grain Inspection
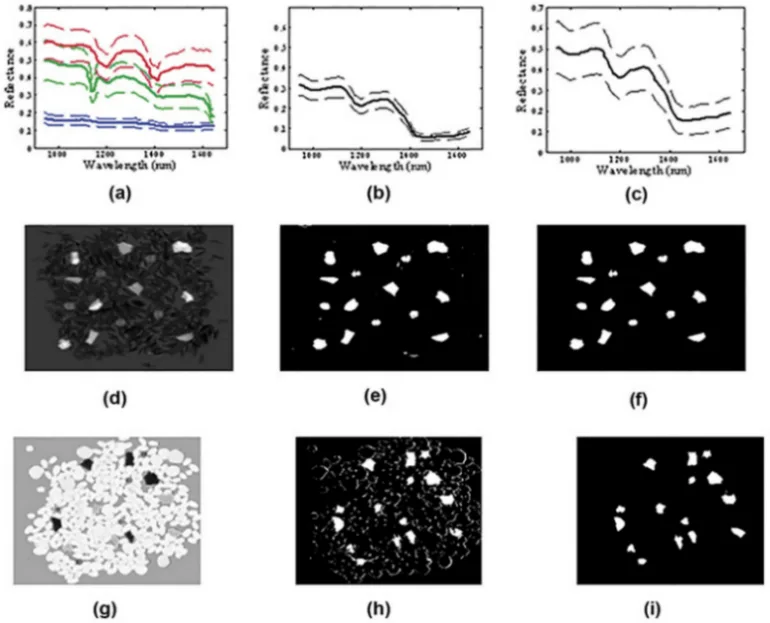
Hyperspectral imaging can support rapid rice quality and variety assessment. Principal component analysis (PCA) reduces the image data to features such as chalkiness and grain shape.
A grain-inspection study reported accuracies of 89.18% for PCA and 89.91% for a back-propagation neural network (BPNN) model. Combining BPNN with data fusion increased accuracy to 94.45%, illustrating the potential for rice variety and quality analysis.
Forest Species Identification
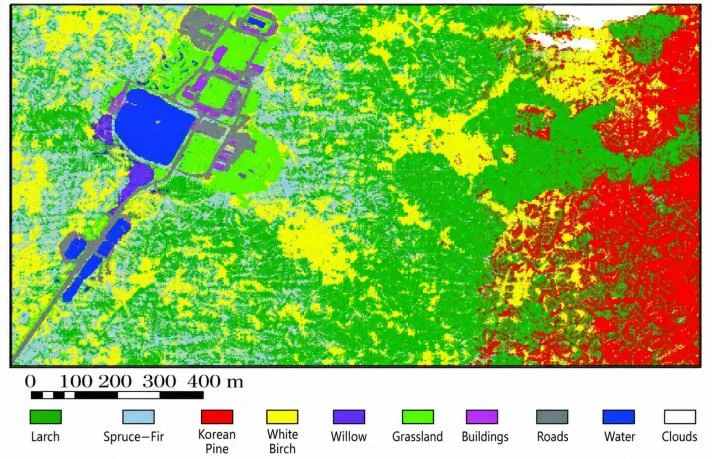
Species identification supports forest-type classification, stand mapping, and forest-resource inventories. Field-derived reference spectra, hyperspectral measurements, and classification models can identify dominant vegetation, forest types, and individual tree species.
These methods also support vegetation distribution and change mapping, grassland biomass estimation, and extraction of crop biophysical and biochemical parameters.
Explore the portable hyperspectral imaging system range for related instruments.