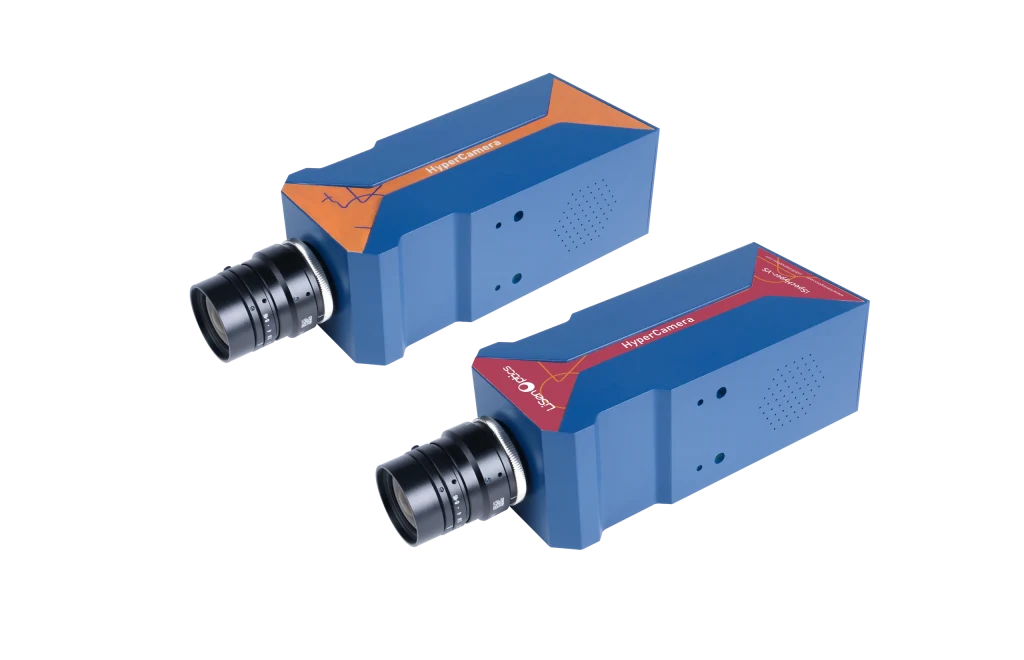
The LiSen Optics iSpecHyper-VS series combines a compact design with high-performance hyperspectral imaging. Its transmission-grating optics and external push-broom architecture support high-speed acquisition and processing, with optical optimization across the full field of view.
The range includes the iSpecHyper-VS100 for 400–1000 nm imaging and the iSpecHyper-VS200-EDU and iSpecHyper-VS200-PRO for 900–1700 nm imaging, plus the iSpecHyper-VS500 for 900–2500 nm imaging. A standard C-mount accepts interchangeable lenses for forensic analysis, precision agriculture, remote sensing, industrial inspection, medical research, and mineral and geological exploration.
Key Features
- Flexible spectral coverage: choose 400–1000 nm, 900–1700 nm, or 900–2500 nm, with spectral resolution better than 10 nm across the series. Model-specific resolutions are listed below.
- High optical throughput: the spectrograph design provides high sensitivity and signal-to-noise ratio.
- Detector options: VS100 uses CMOS, VS200-EDU and VS500 use uncooled InGaAs, and VS200-PRO uses TE-cooled InGaAs. ENVI-compatible data output and multiple regions of interest (multi-ROI) are supported by the VS100/VS200 configurations.
- Automated operation: optional motorized autofocus, automatic exposure, and synchronized scanning support acquisition workflows.
- Full-field image quality: VS100 and VS200 models provide a spot diameter of <0.5 pixel across the full field. The VS500 optical design is optimized across the full sensor area.
- Interchangeable lenses: 12.5, 25, 35, and 75 mm objective lenses are available for VS100/VS200 configurations. VS500 also uses a standard C-mount for interchangeable lenses.
Models and Product Views
iSpecHyper-VS500: 900–2500 nm Imaging
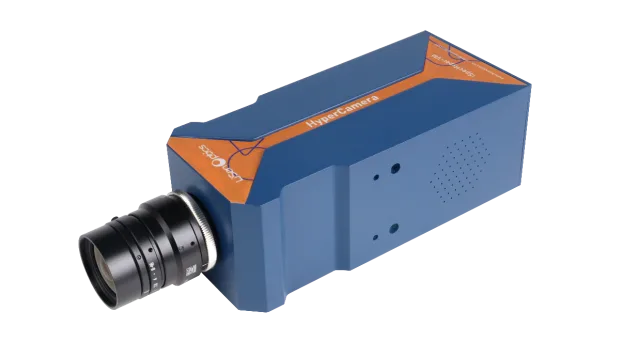
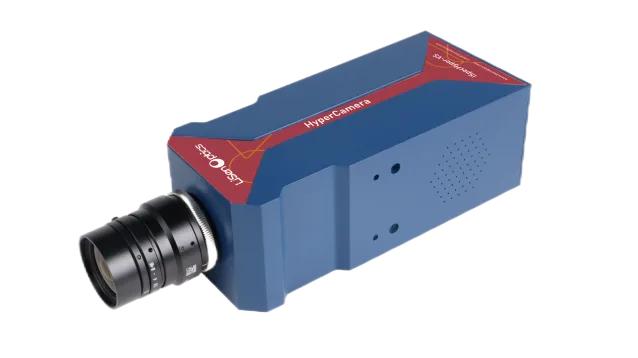
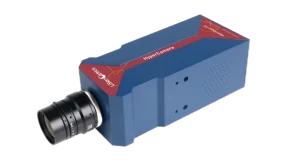
The iSpecHyper-VS500 uses a folded-path transmission-grating spectrograph, an uncooled InGaAs detector, and external push-broom scanning. It provides spectral resolution better than 10 nm, at least 400 spectral bands, and a frame rate of at least 100 fps. The camera weighs <8 kg and measures approximately 500 × 150 × 150 mm, excluding the lens.
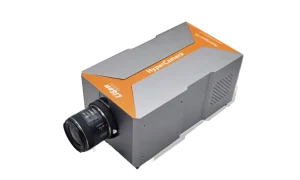
Product views illustrate the series housings. Refer to the model-specific dimensions and specifications below.
Technical Specifications
| Parameter | iSpecHyper-VS100 | iSpecHyper-VS200-EDU | iSpecHyper-VS200-PRO | iSpecHyper-VS500 |
|---|---|---|---|---|
| Product Image |
 |
 |
|
|
| Spectral Range | 400–1000 nm | 900–1700 nm | 900–1700 nm | 900–2500 nm |
| Spectrograph Design | Transmission grating | Straight-through transmission grating | Straight-through transmission grating | Folded-path transmission-grating spectrograph |
| F-number | F/2.6 | F/2.0 | F/2.0 | F/2.0 |
| Spectral Resolution | Better than 2.5 nm | Better than 10 nm | Better than 6 nm | Better than 10 nm |
| Detector | CMOS | InGaAs (uncooled) | InGaAs (TE-cooled) | InGaAs (uncooled) |
| Detector Active Area | 1/1.2", 11.3 × 7.1 mm | Not specified | Not specified | Not specified |
| Detector Resolution | 1920 (spatial) × 1200 (spectral) | 1280 × 1024 | 640 × 512 | 640 × 512 pixels |
| Native Pixel Size | 5.86 × 5.86 µm | 5 × 5 µm | 15 × 15 µm | 15 µm × 15 µm |
| Imaging Method | External push-broom scanning | External push-broom scanning | External push-broom scanning | External push-broom scanning |
| Recommended Binning | 4 × 4 | 2 × 2 | 1 × 1 | 1 × 1 |
| Spectral Channels / Bands | 300 | 400 | 512 | ≥400 |
| Effective Spatial Pixels | 480 | 640 | 640 | 640 |
| Spectral Sampling Interval | Not specified | 2.2 nm | 1.7 nm | 3 nm |
| Field of View (FOV) | 15.6° @ f = 35 mm | 22.6° @ f = 35 mm | 15.6° @ f = 35 mm | 21.8° @ f = 25 mm |
| Instantaneous Field of View (IFOV) | 0.71 mrad @ f = 35 mm | 0.625 mrad @ f = 35 mm | 0.43 mrad @ f = 35 mm | 1.2 mrad @ f = 25 mm |
| Frame Rate | GigE: 41 fps; USB 3.0: 41 fps | 125 fps | 175 fps | ≥100 fps |
| Pixel Bit Depth | 12-bit | 12-bit | 14-bit | 12-bit |
| Slit Width | 25 µm | 30 µm | 30 µm | 30 µm |
| Detector Interface | GigE / USB 3.0 | USB 3.0 | GigE | USB 3.0 / Gigabit Ethernet |
| Power Supply | External 12–24 VDC / 3 W | Not specified | Not specified | Not specified |
| Operating Temperature | 0–40 °C | 0–40 °C | 0–40 °C | 0–40 °C |
| Storage Temperature | 0–50 °C | 0–50 °C | 0–50 °C | 0–50 °C |
| Weight | ≤710 g | <3 kg | <3 kg | <8 kg |
| Dimensions | 234 × 76 × 66 mm | 300 × 105 × 90 mm (excluding lens) | 300 × 105 × 90 mm (excluding lens) | Approx. 500 × 150 × 150 mm (excluding lens) |
“Not specified” means the value is not listed for that model in the technical specifications. Transmission-grating optics and external push-broom scanning are shared series features; spectrograph geometry and detector specifications vary by model.
Software User Interface
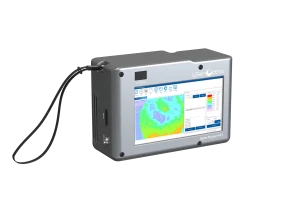
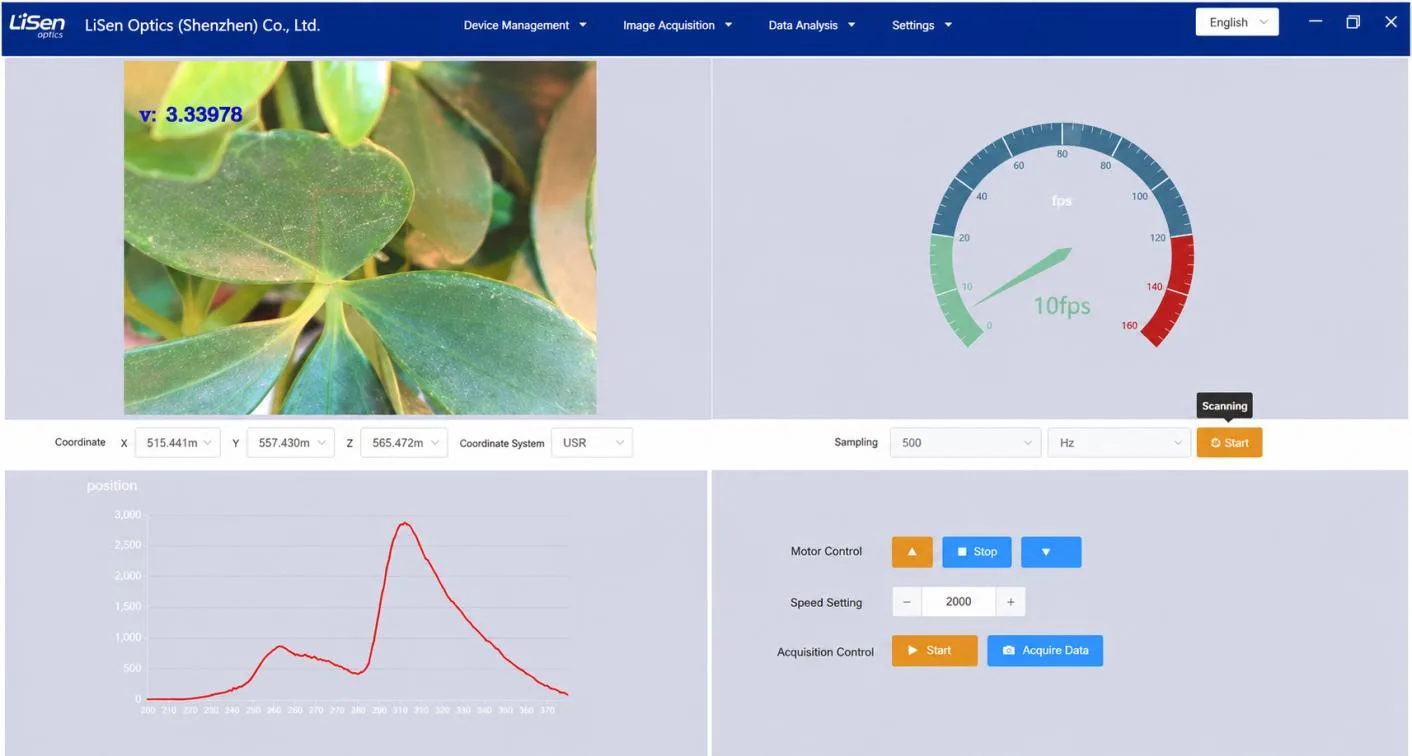
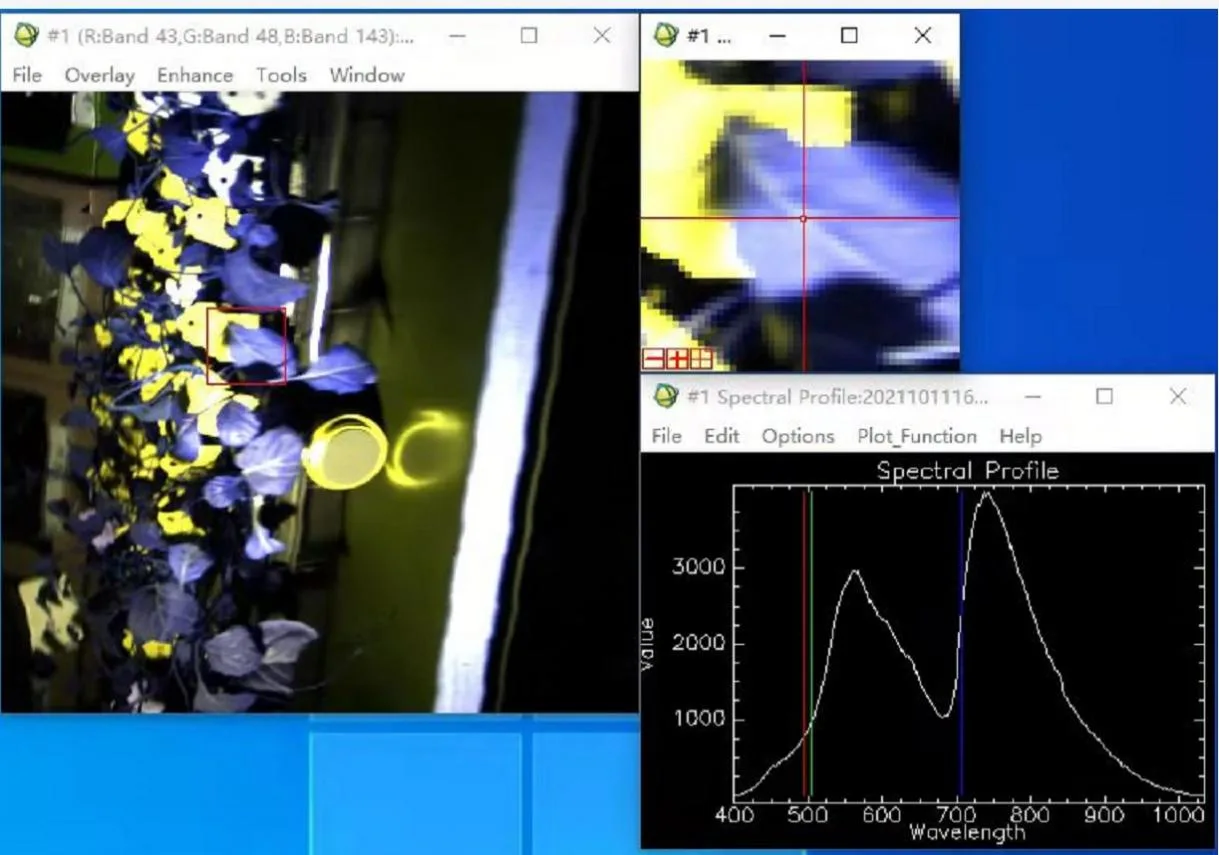
The software interface brings image acquisition, data analysis, spectral-profile viewing, and scanning controls into the measurement workflow.
Typical Applications
Choose the model for the wavelength region required by the application. The visible-band examples below fall within the VS100 spectral range.
Agriculture
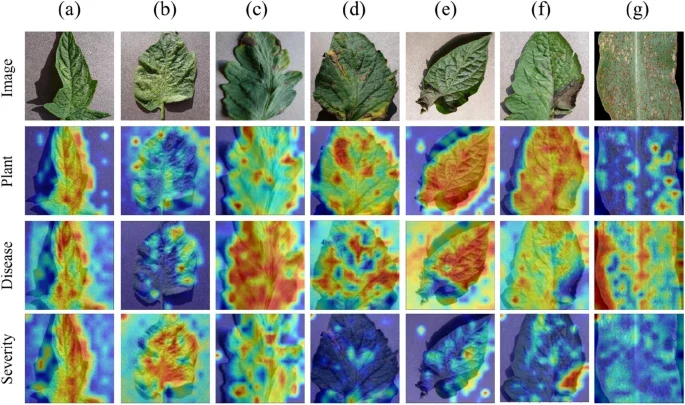
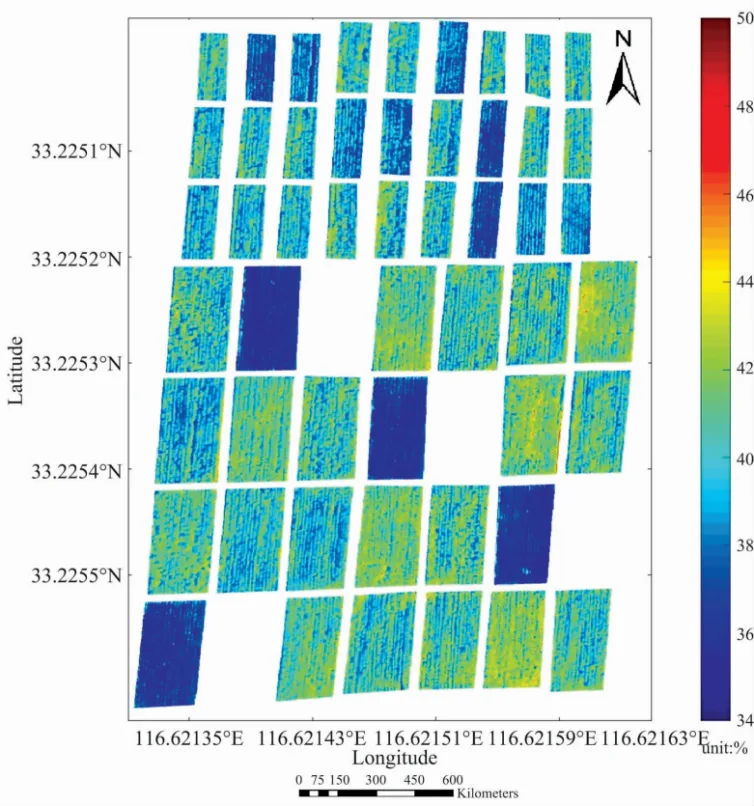
Crop stress and disease monitoring. Hyperspectral imaging detects spectral and spatial changes associated with pests, disease, and crop stress. Chlorosis and wilting produce distinct spectral signatures. Comparing healthy and affected vegetation can help identify disease type and assess severity.
Crop nutrient status monitoring. Hyperspectral remote sensing can assess nutrient status and crop growth to support timely management decisions. The contiguous bands and finer spectral resolution of UAV hyperspectral imaging provide more sensitive discrimination of crop responses across wavelengths than multispectral systems.
Forestry
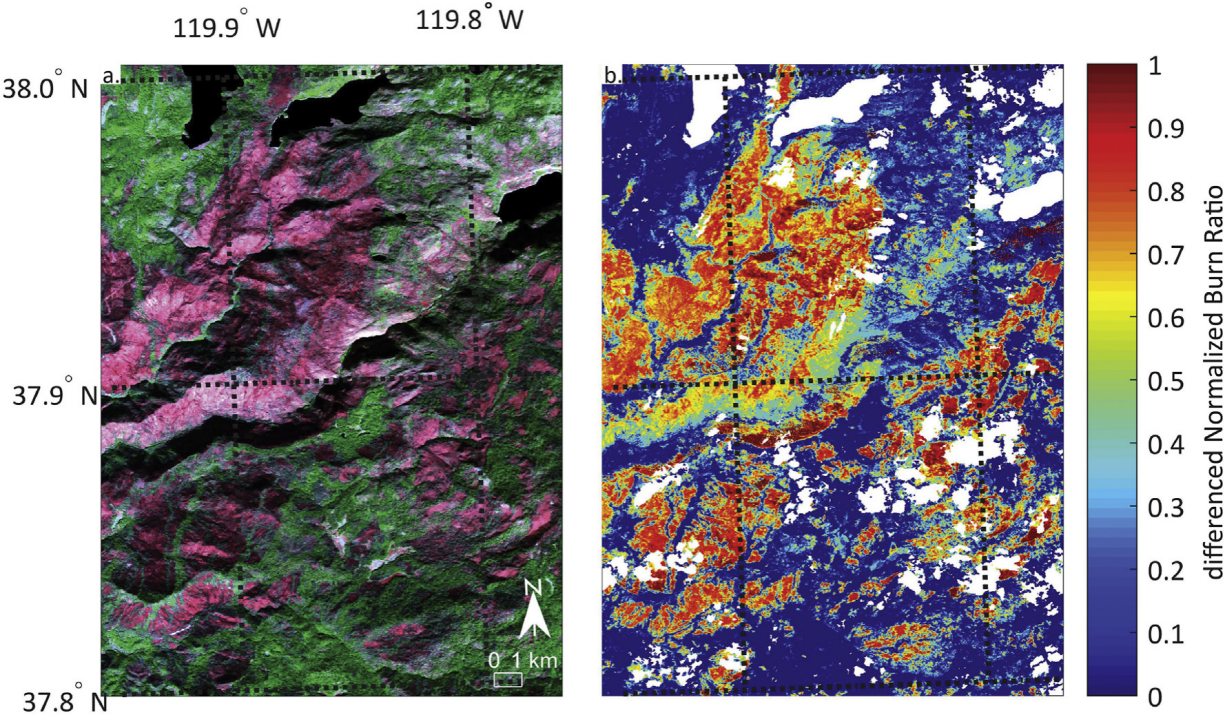
Forest disturbance and fire monitoring. Vegetation-cover and soil-related spectral indices support forest-fire detection and burn-severity assessment, helping teams evaluate large areas rapidly.
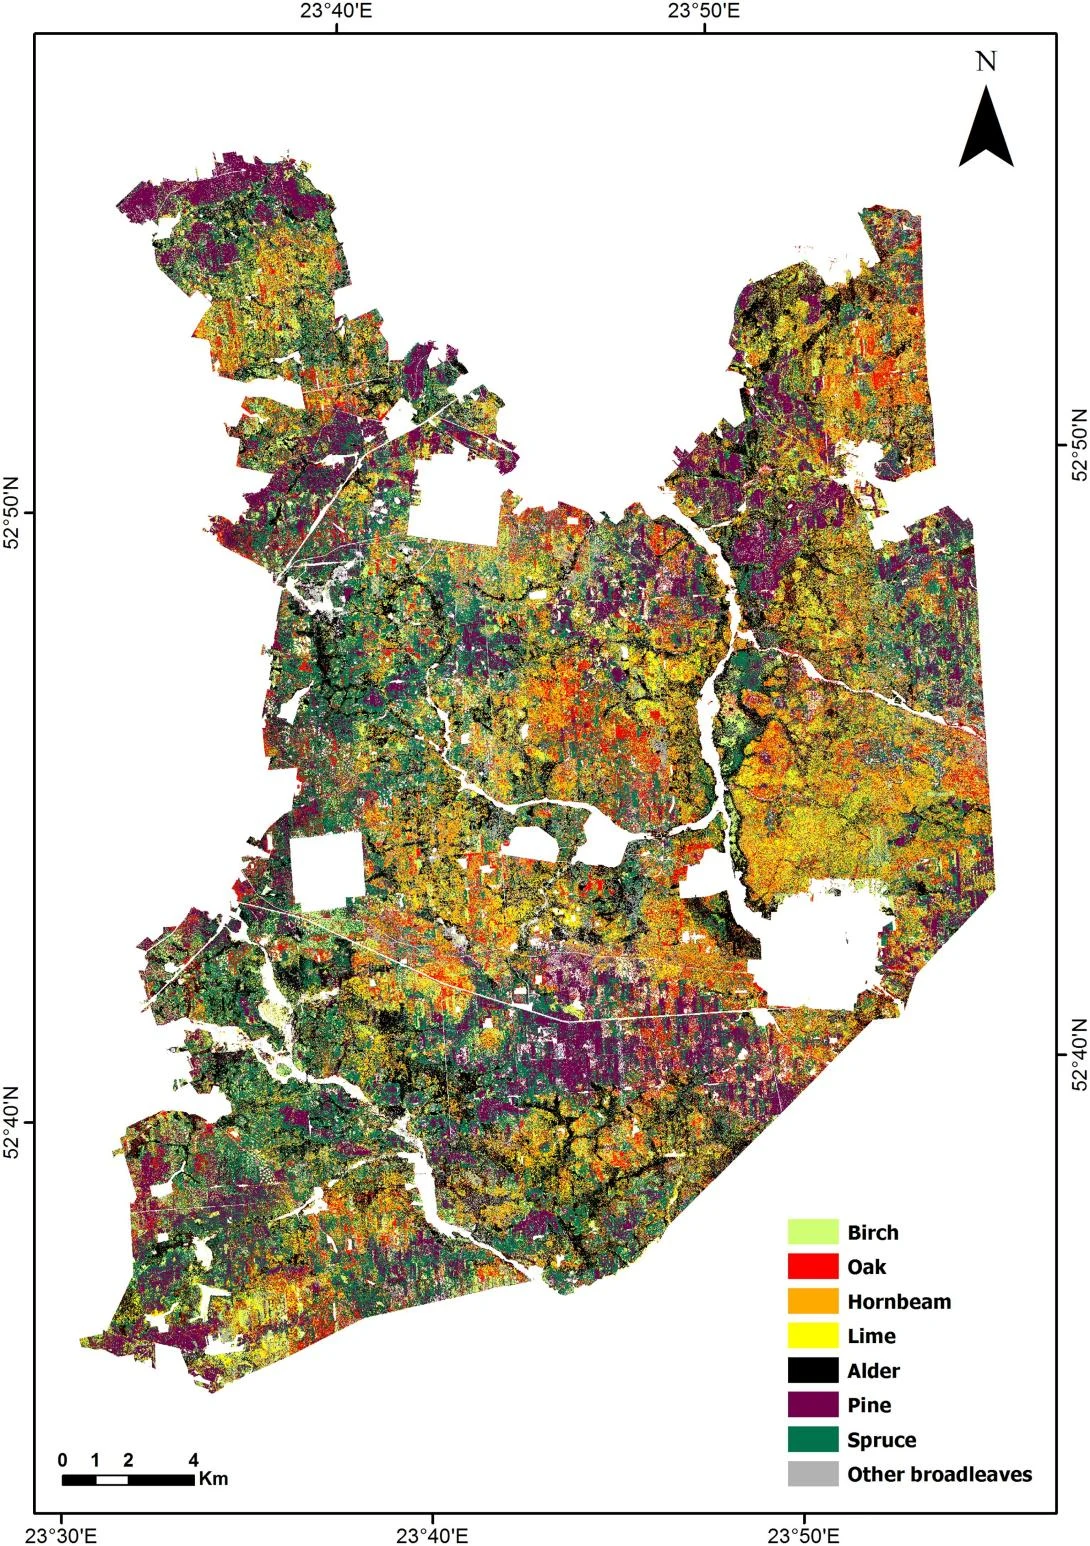
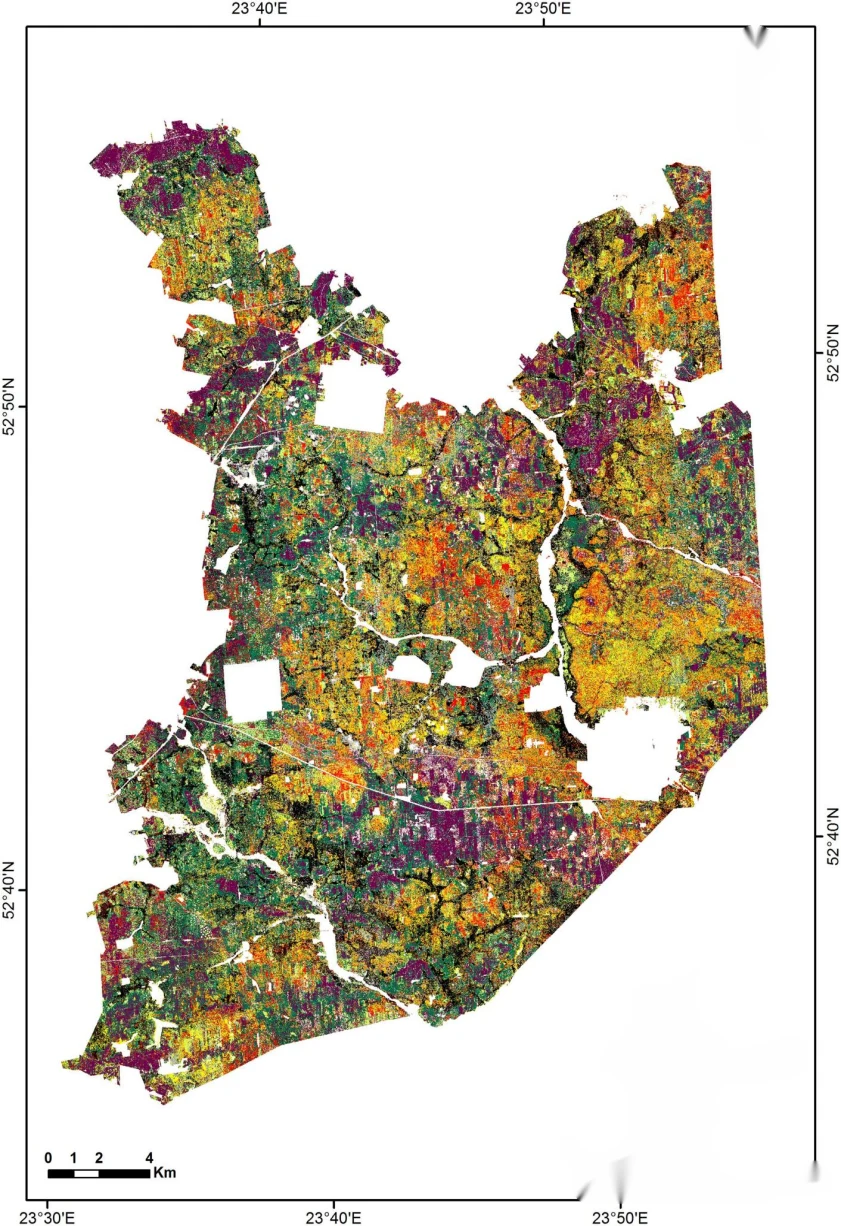
Tree species classification. Continuous visible-to-near-infrared data capture subtle reflectance differences among leaves, bark, and other plant tissues. Band-specific features can help distinguish tree species, including those with similar leaf shapes.
Aquatic Environment Monitoring
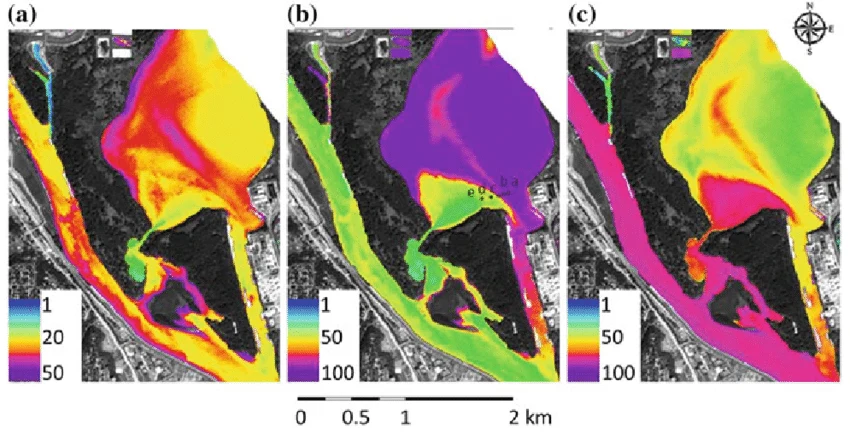
Fine spectral resolution supports identification and estimation of chlorophyll, tannic acid, and suspended sediment in water. Hyperspectral data also support algal-growth monitoring and studies of phytoplankton distribution and fish-school location.
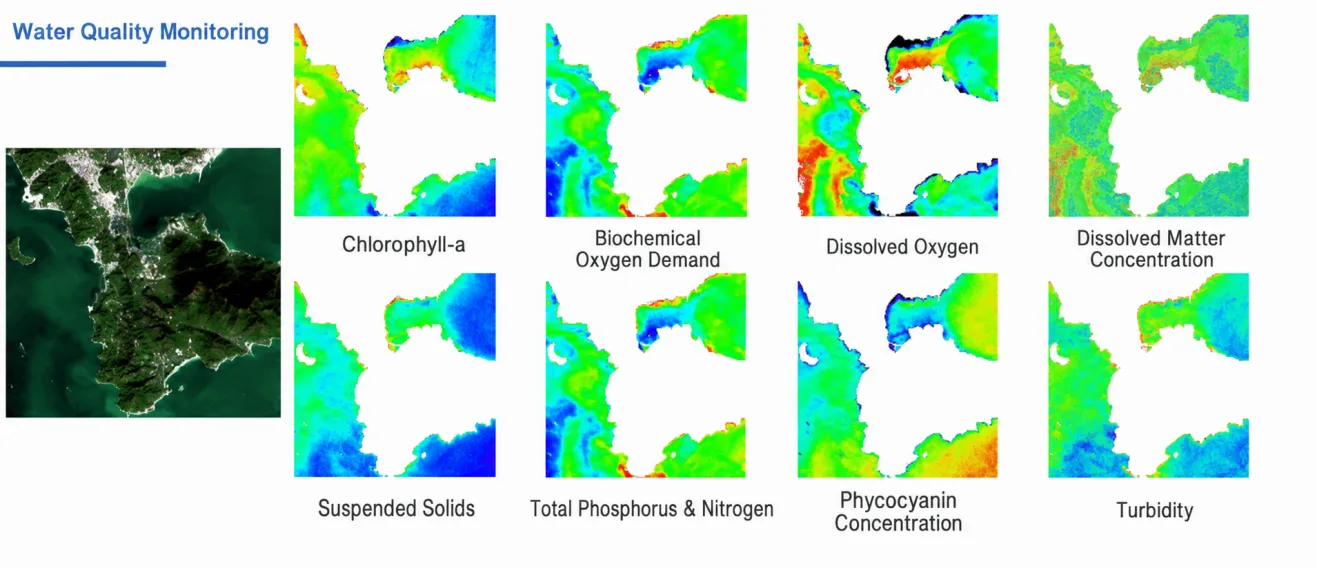
Chlorophyll shows strong absorption in the blue (400–500 nm) and red (600–700 nm) regions and higher reflectance at 700–750 nm. These spectral features can help estimate chlorophyll concentration and monitor trophic conditions and algal blooms.
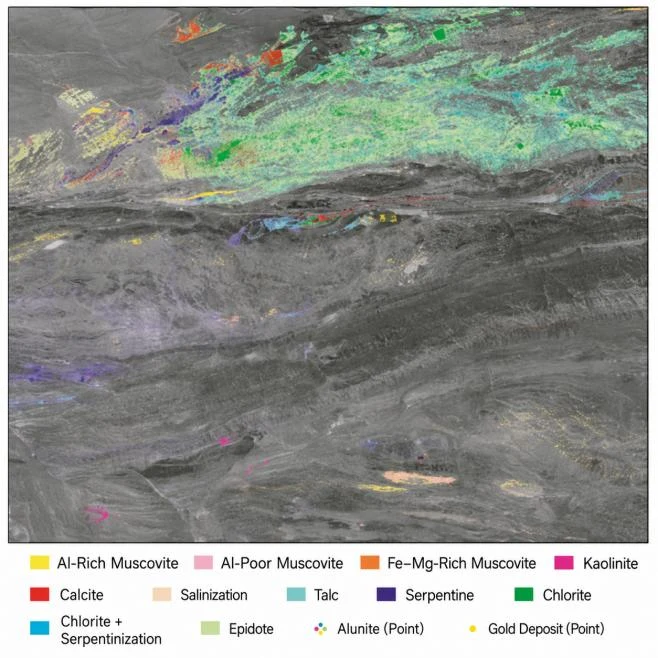
Mineral Identification and Geological Exploration
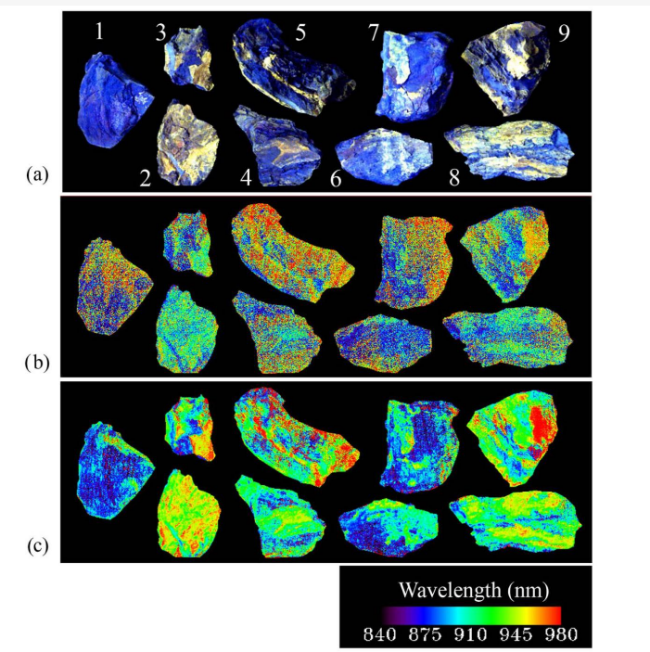
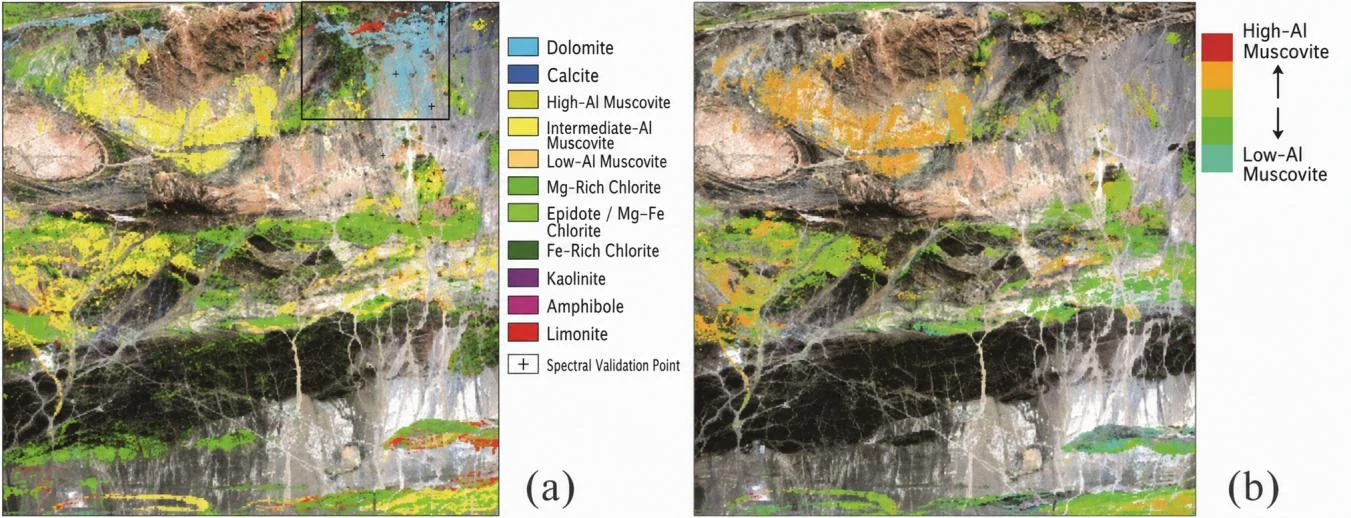
Hyperspectral remote sensing identifies and maps surface mineralogy for mineral-resource exploration. Applications include hydrothermal alteration mapping and geochemical and geological mapping. Characteristic spectral responses help extract detailed information about mineral composition.
Camouflage Material Identification
Hyperspectral imaging uses spectral differences between objects and camouflage materials to detect concealed objects and distinguish material types. In defense-related applications, short-wave infrared hyperspectral imaging can also support identification of camouflage netting in complex field environments.
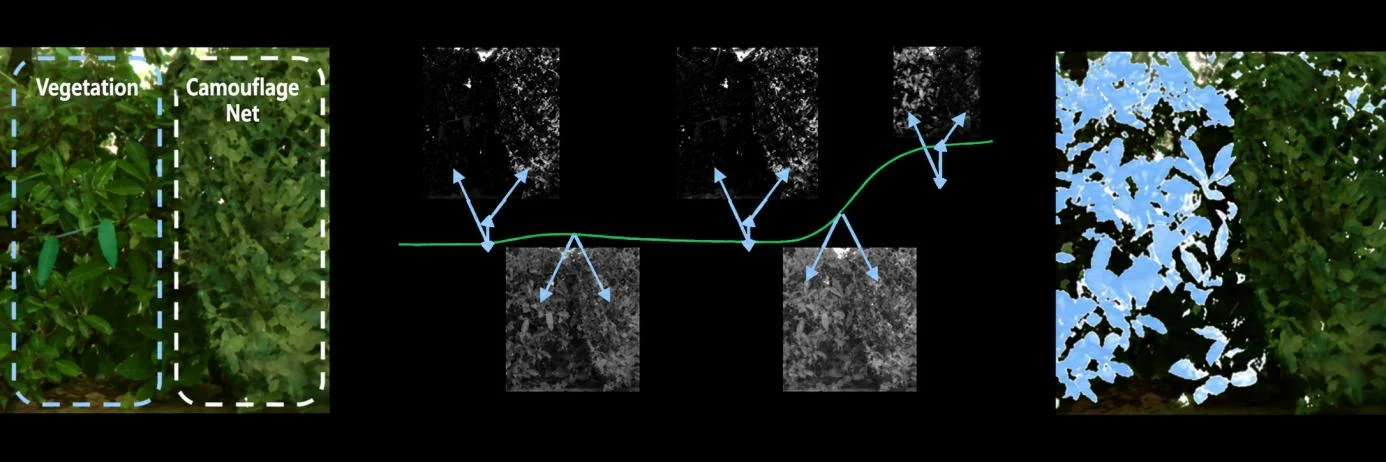
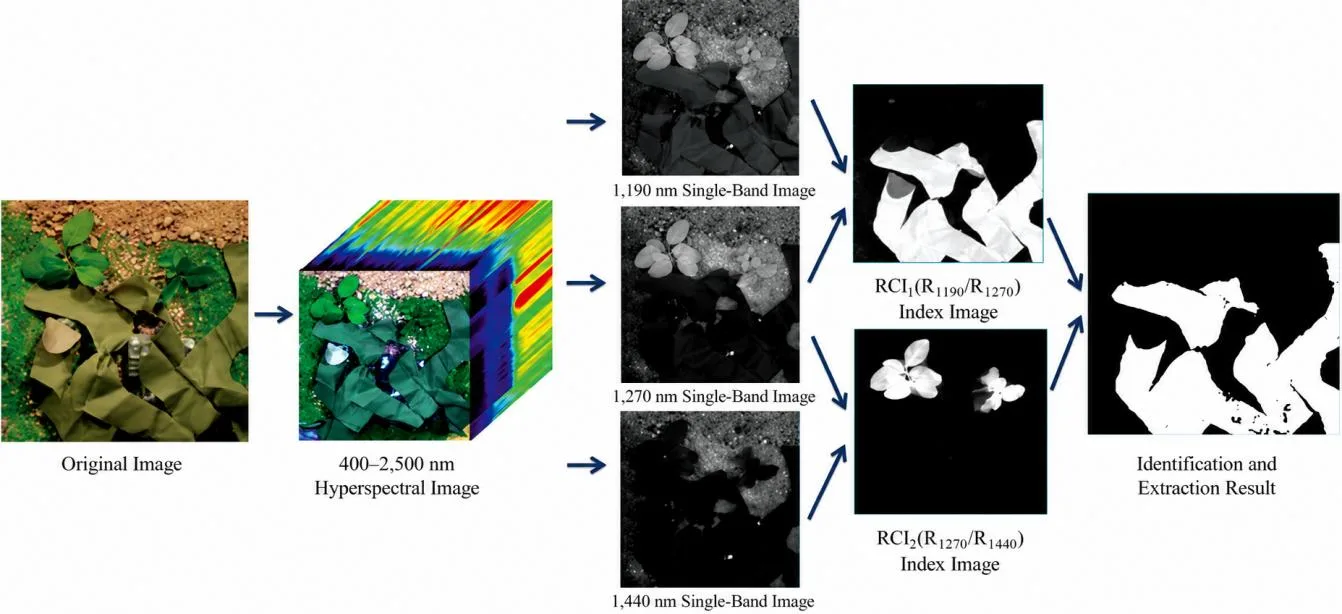
Research example uses a 400–2500 nm dataset. The listed camera configurations cover 400–1000 nm, 900–1700 nm, or 900–2500 nm.
For model selection, lens options, or system integration, contact LiSen Optics. Explore the hyperspectral camera range for related products.